

Question: Scott drops a ball from various heights and records the time, x, that it takes for the ball to hit the ground, using a motion
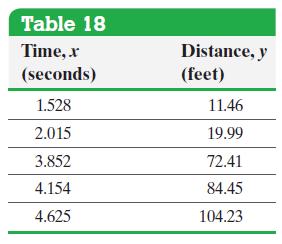
Scott drops a ball from various heights and records the time, x, that it takes for the ball to hit the ground, using a motion detector. He obtains the data displayed in Table 18.
(a) Draw a scatter diagram of the data, treating the time, x, as the explanatory variable. Comment on the shape of the scatter diagram.
(b) Determine Y = log y and X = log x, and draw a scatter diagram treating X = log x as the explanatory variable and Y = log y as the response variable. Comment on the shape of the scatter diagram.
(c) Find the least-squares regression line of the transformed data.
(d) Determine the power equation of best fit, and graph it on the scatter diagram obtained in part (a).
(e) Use the power equation of best fit to predict the distance a ball will have to fall to take 4.2 seconds to hit the ground.
Approach
(a) Plot the ordered pairs (x, y).
(b) Determine the logarithms of the x- and y-values so that X = log x and Y = log y.
Then plot the ordered pairs (X, Y) = (log x, log y).
(c) Use Minitab to find the least-squares regression line of the transformed data.
(d) The least-squares regression line will be of the form log y = log a + b log x = A + bX, where A is the y-intercept and b is the slope of the least-squares regression line. To find
a, let a = 10A. The power equation of best fit is ŷ = axb.
To graph the equation, evaluate the power equation of best fit at various values of x to determine the corresponding value of y. Then plot these points and connect them into a smooth curve.
(e) Let x = 4.2 in the power equation of best fit.
Table 18 Time,.x (seconds) Distance, y (feet) 1.528 11.46 2.015 19.99 3.852 72.41 4.154 84.45 4.625 104.23
Step by Step Solution
3.46 Rating (156 Votes )
There are 3 Steps involved in it

Get step-by-step solutions from verified subject matter experts