

Question: These are basic math and data analysis/statistics questions. Analyse the graphs and information below to answer all the questions. Please show all your workings. Market
These are basic math and data analysis/statistics questions. Analyse the graphs and information below to answer all the questions. Please show all your workings.
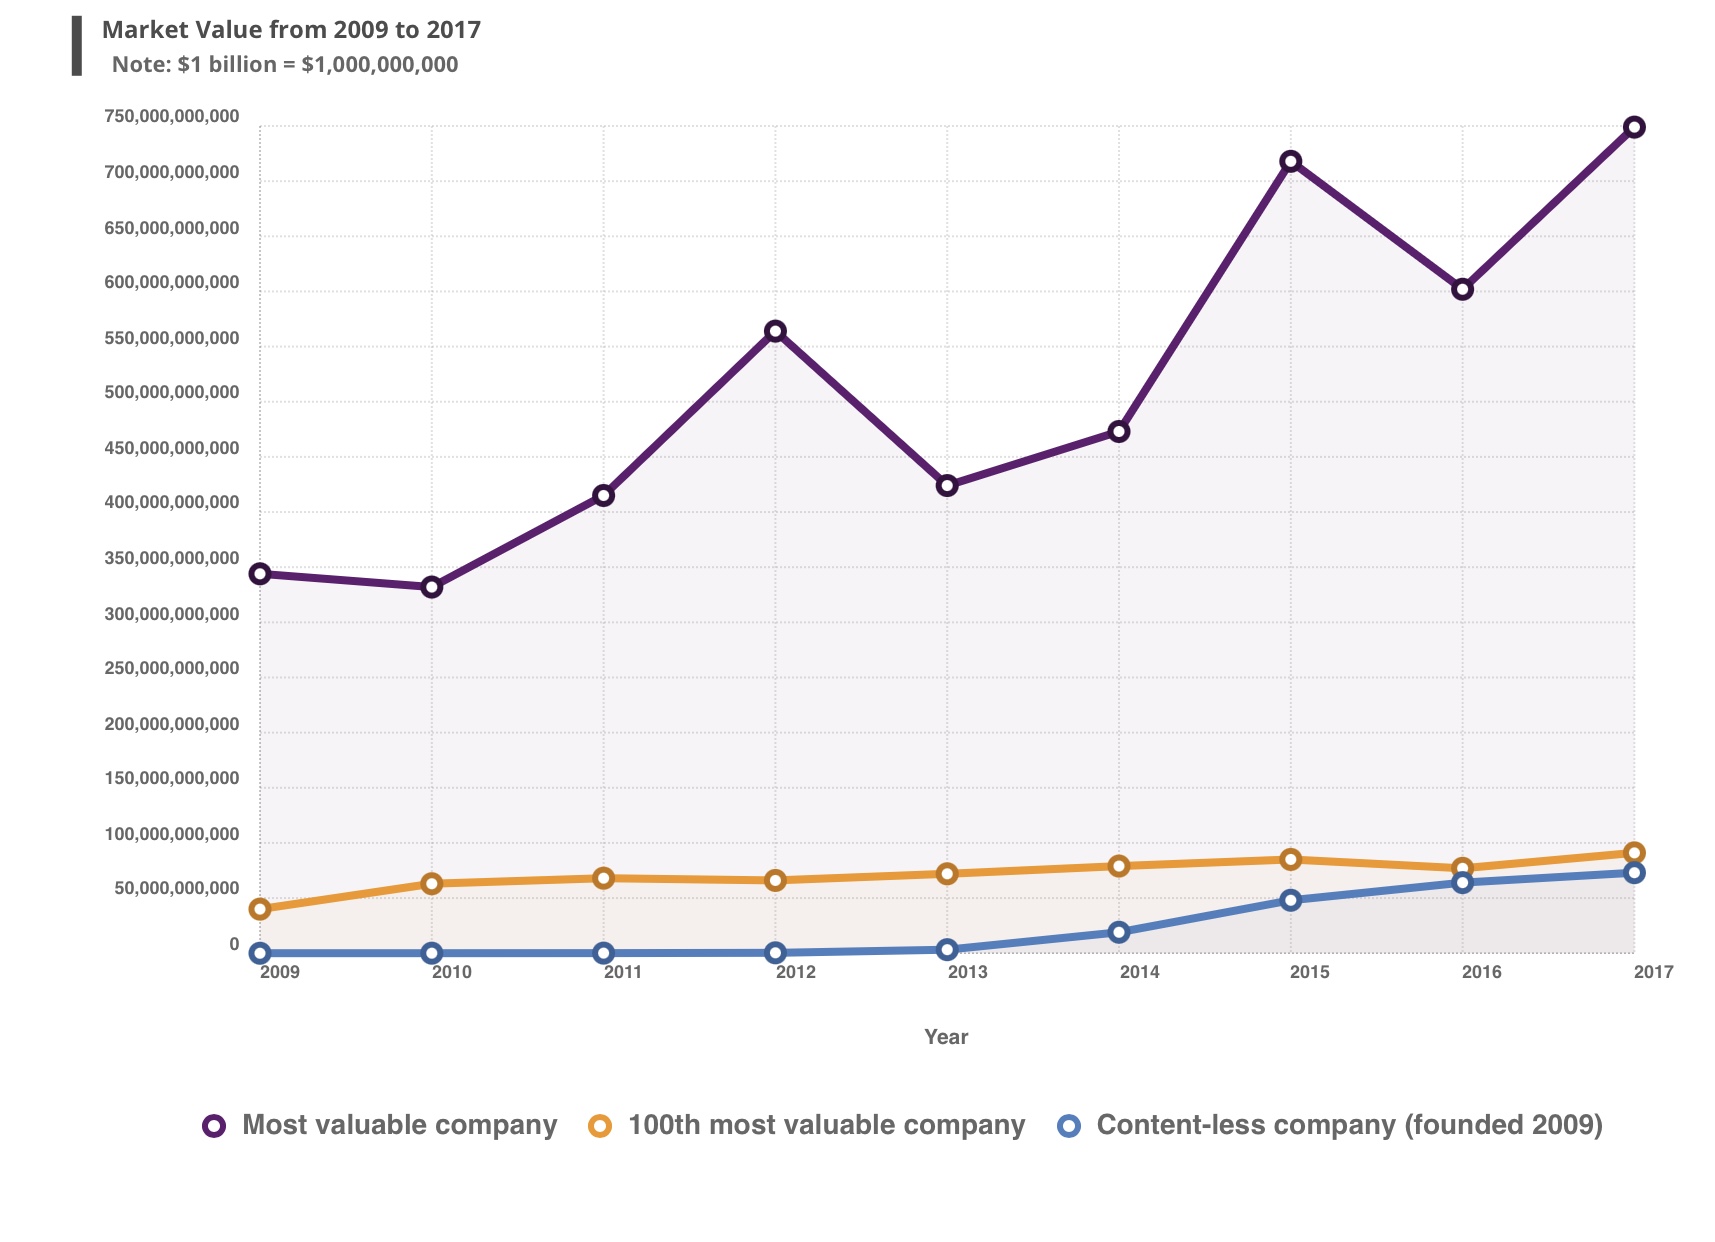
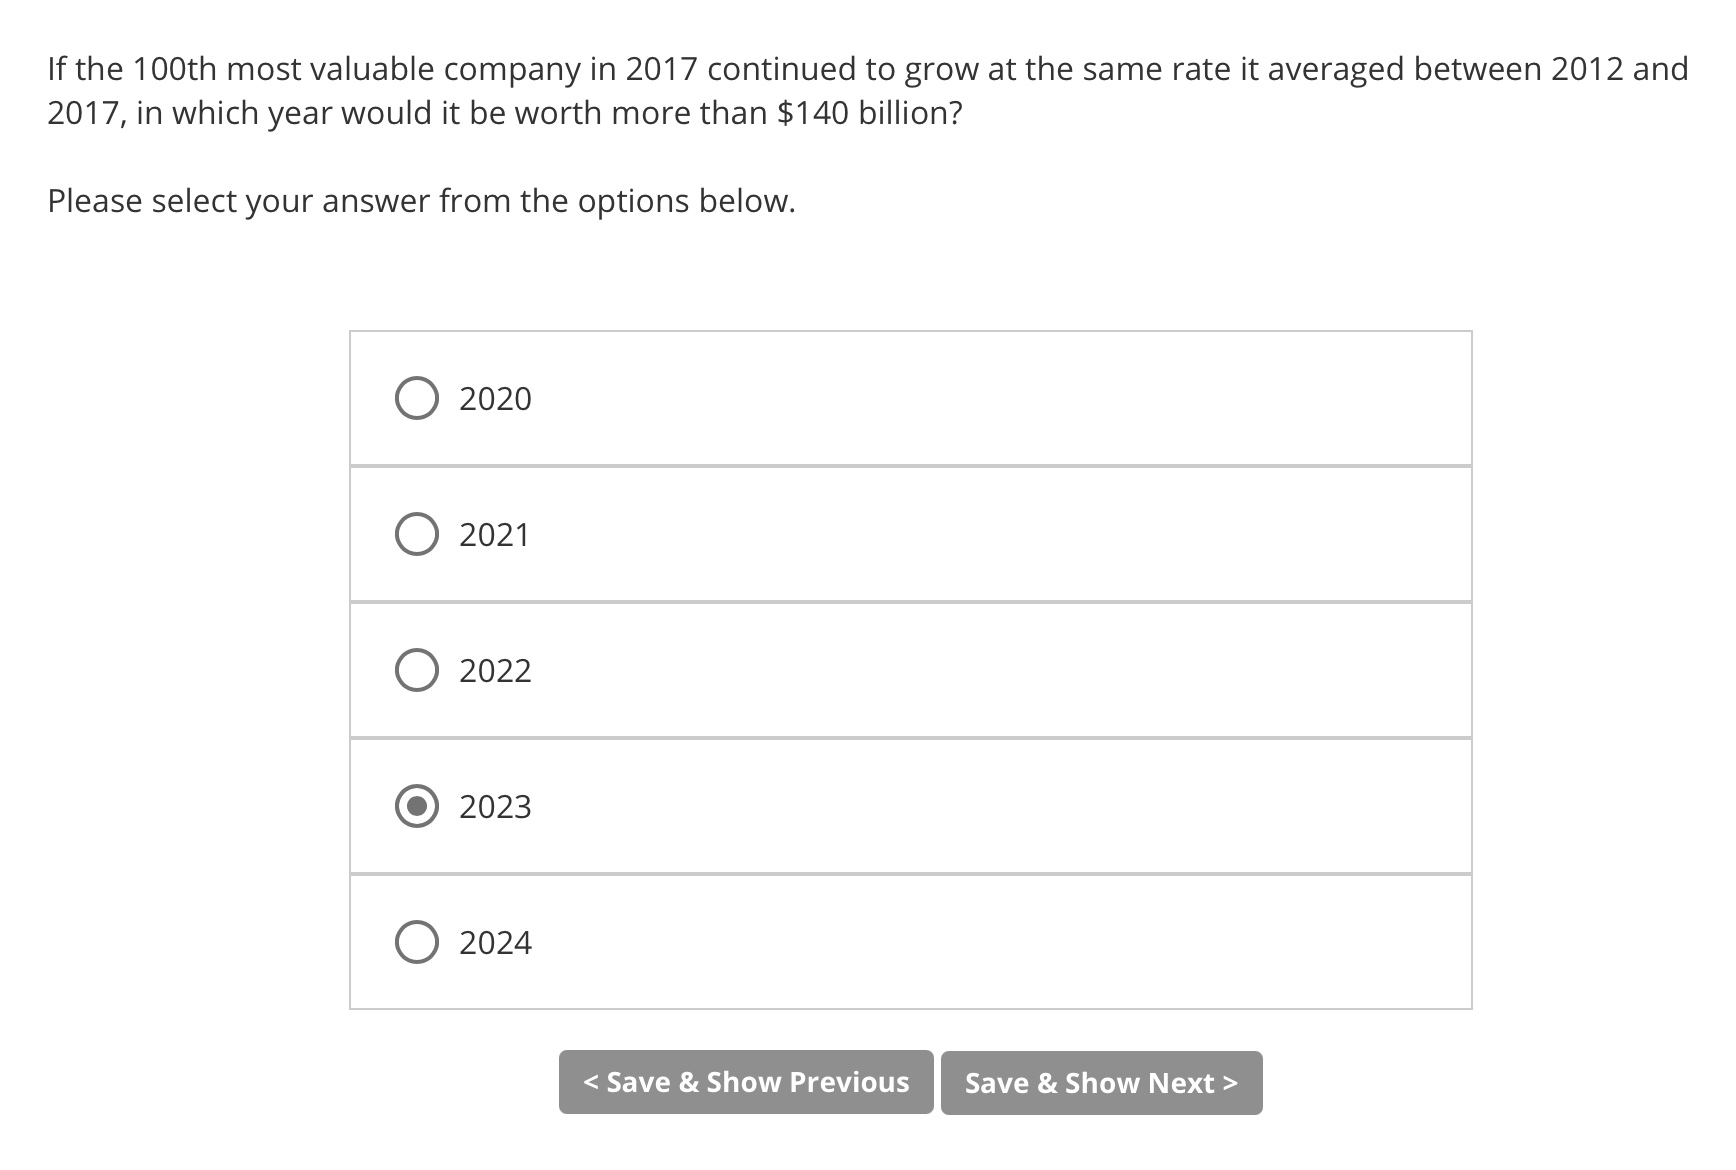
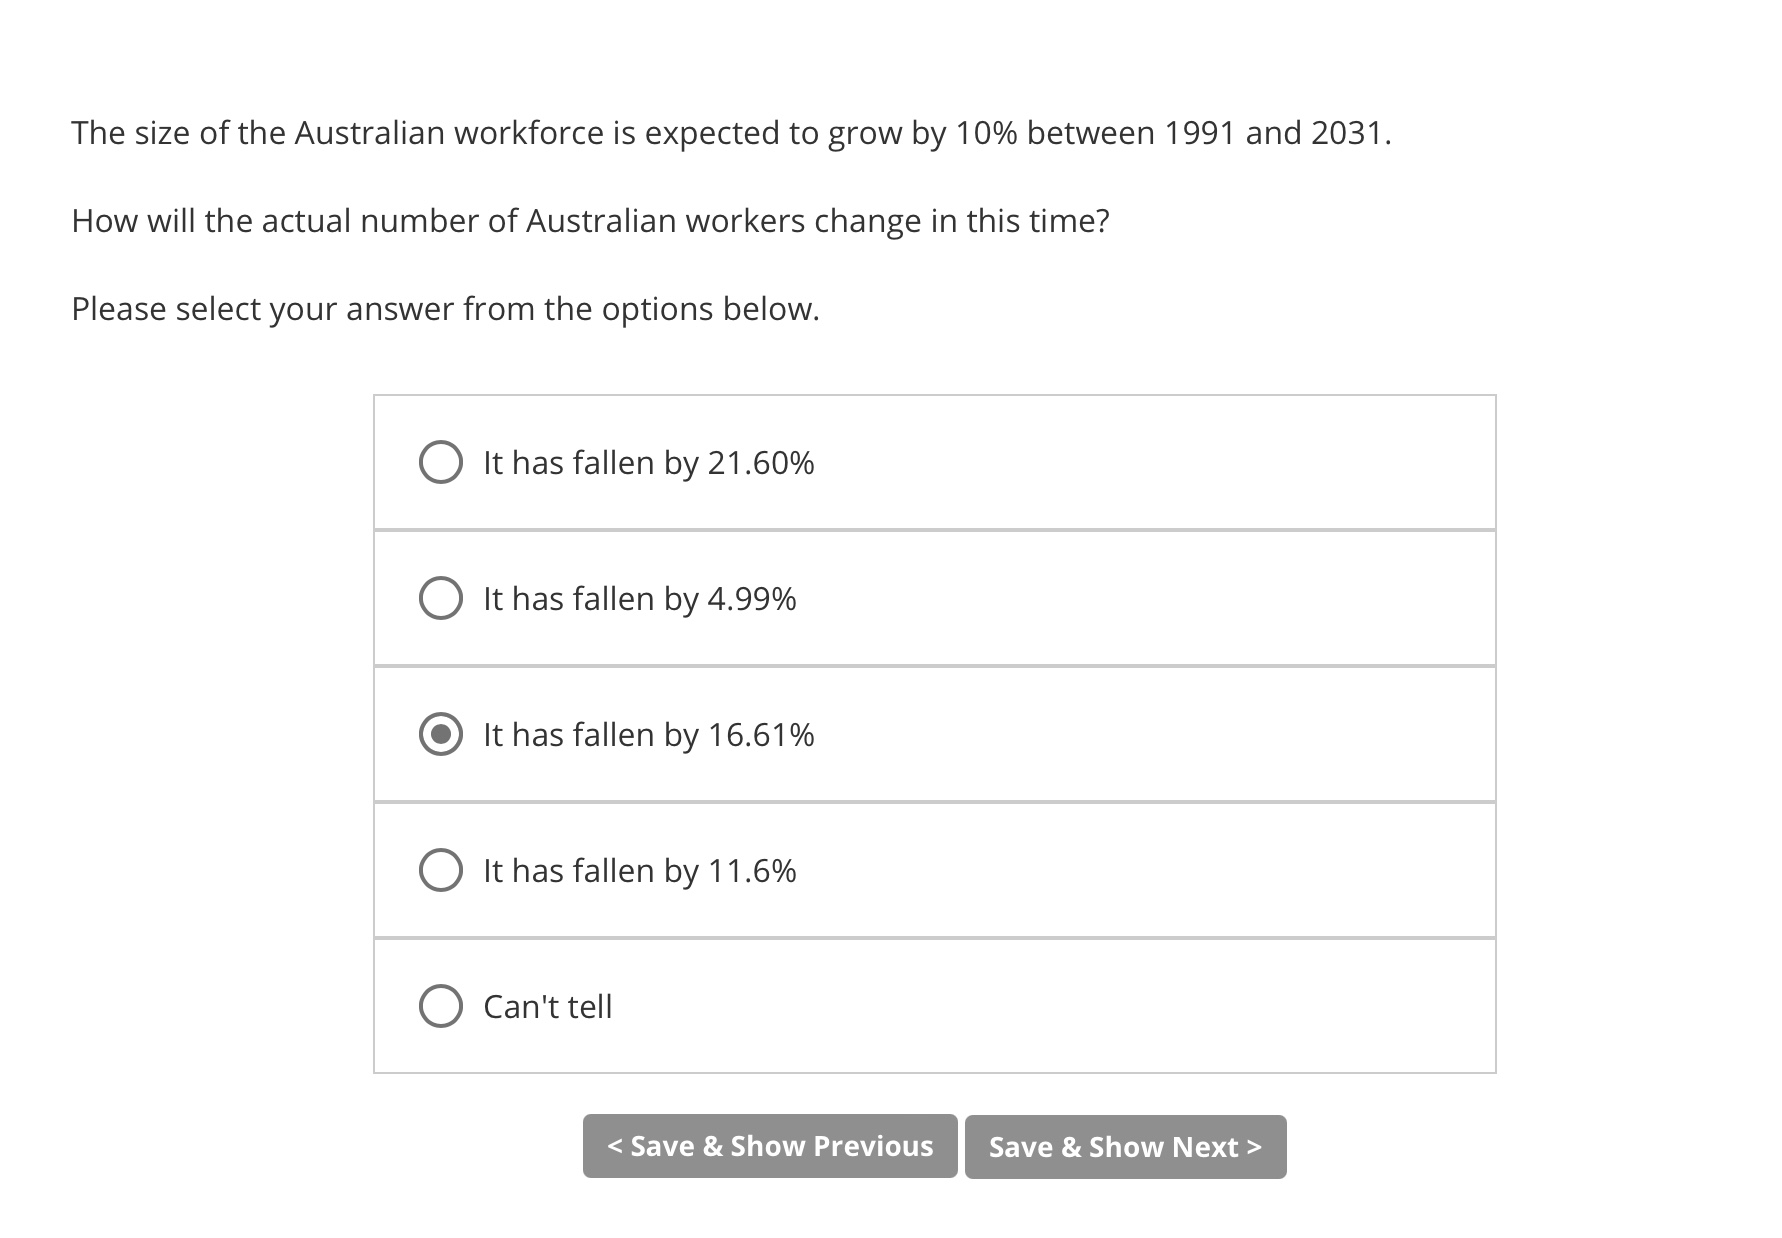

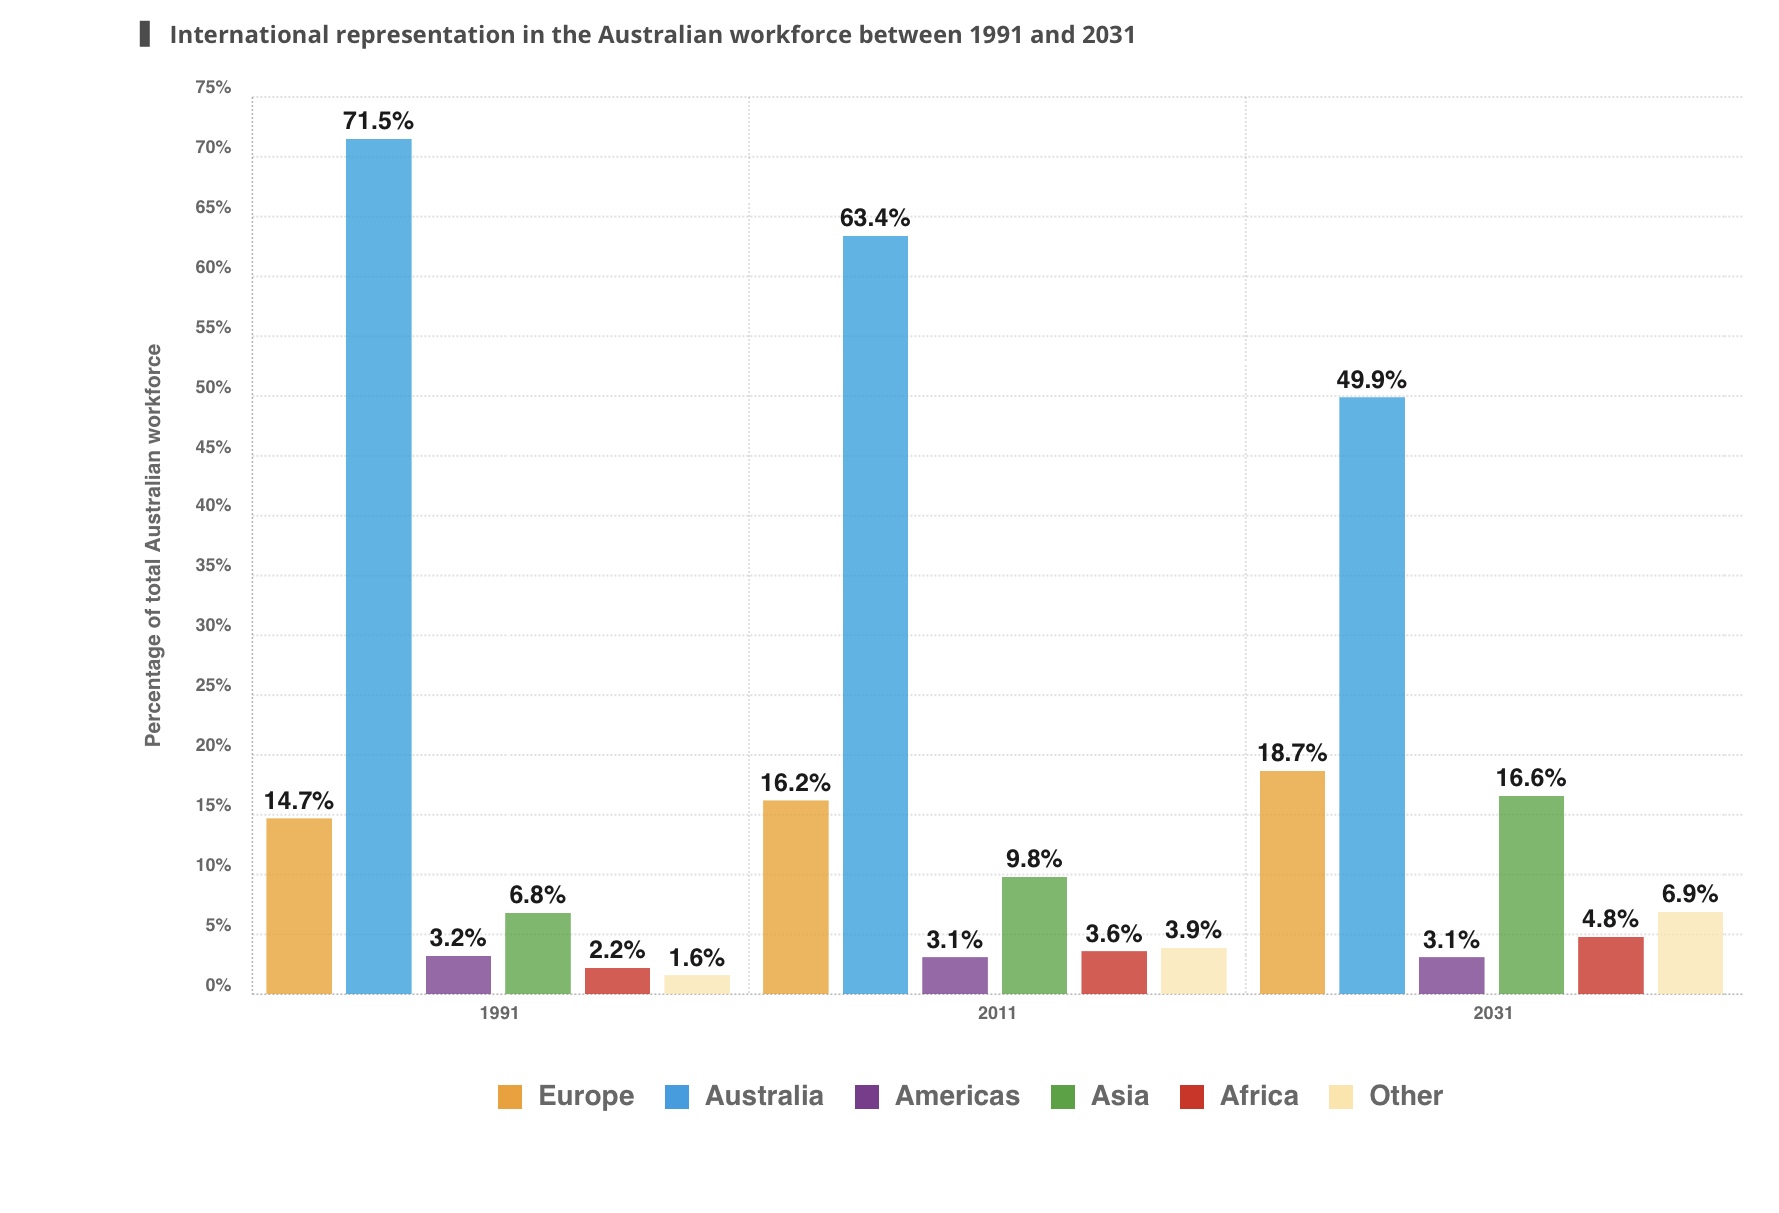
Market Value from 2009 to 2017 Note: $1 billion = $1,000,000,000 750,000,000,000 700,000,000,000 650,000,000,000 600,000,000,000 550,000,000,000 500,000,000,000 450,000,000,000 400,000,000,000 350,000,000,000 300,000,000,000 250,000,000,000 200,000,000,000 150,000,000,000 100,000,000,000 50,000,000,000 O O O 2009 2010 2011 2012 2013 2014 2015 2016 2017 Year Most valuable company . 100th most valuable company O Content-less company (founded 2009)If the 100th most valuable company in 2017 continued to grow at the same rate it averaged between 2012 and 2017, in which yearwould it be worth more than $140 billion? Please select your answer from the options below. The size of the Australian workforce is expected to grow by 10% between 1991 and 2031. How will the actual number of Australian workers change in this time? Please select your answer from the options below. 0 It has fallen by 21.60% 0 It has fallen by 4.99% (Q It has fallen by 16.61% 0 It has fallen by 11.6% 0 Can't tell Ifthe total size of the Australian workforce was 11 million in 2011 and is projected to grow to 17 million in 2031, what would we expect the percentage increase in the number of workers of African origin during this time to be? Please state your answer to two decimal places. International representation in the Australian workforce between 1991 and 2031 75% 71.5% 70% 65% 63.4% 60% 55% 49.9% 50% 45% 40% Percentage of total Australian workforce 35% 30% 25% 20% 18.7% 16.6% 16.2% 15% 14.7% 9.8% 10% 6.9% 6.8% 4.8% 5% 3.1% 3.6% 3.9% 3.2% 3.1% 2.2% 1.6% 0% 2031 1991 2011 Europe Australia Americas Asia Africa Other
Step by Step Solution
There are 3 Steps involved in it

Get step-by-step solutions from verified subject matter experts