

Question: These are the all the information the problem has Please use excel ans show work Intro The return statistics for two stocks and the risk-free
These are the all the information the problem has Please use excel ans show work 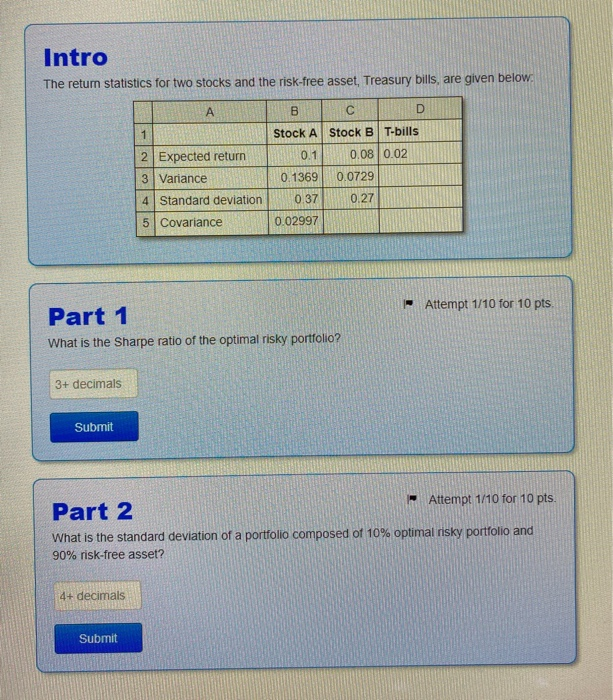
Intro The return statistics for two stocks and the risk-free asset, Treasury bills, are given below 2 Expected return 3 Variance Standard deviation 5 Covariance Stock A 0.1 0.1369 0.37 0.02997 Stock B T-bills 0.08 0.02 0.0729 0.27 - Attempt 1/10 for 10 pts. Part 1 What is the Sharpe ratio of the optimal risky portfolio? 3+ decimals Submit Part 2 Attempt 1/10 for 10 pts. What is the standard deviation of a portfolio composed of 10% optimal risky portfolio and 90% risk-free asset? 4+ decimals Submit
Step by Step Solution
There are 3 Steps involved in it
1 Expert Approved Answer
Step: 1 Unlock

Question Has Been Solved by an Expert!
Get step-by-step solutions from verified subject matter experts
Step: 2 Unlock
Step: 3 Unlock