

Question: These are the data collected over two years on the recruiting function at General Hospital. The hospital has been having problems recruiting enough qualified nurse
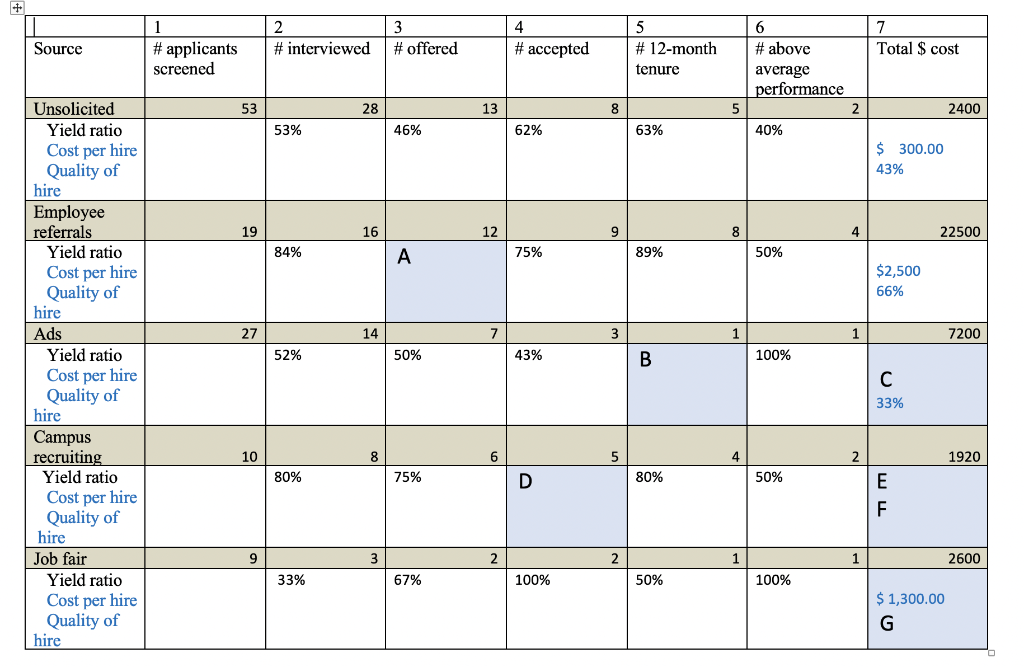
These are the data collected over two years on the recruiting function at General Hospital. The hospital has been having problems recruiting enough qualified nurse specialists who remain with the hospital for more than a year. Furthermore, the budget for recruiting has been increasing but the results are not being achieved. You have been brought in to review the data and recommend some changes that will:a) increase the number of nurse specialists hiredb) increase the quality of nurse specialists hiredc) reduce turnover of nurse specialistsd) reduce selection costs. Using the data here and the material in the text, what are your recommendations?
Suggestions: Since the point of this exercise is to compare the sources, summing the columns does not give you useful information. Instead, determine the appropriate yield ratios that pertain to each question and calculate for each source. Select the source(s) with the best (i.e., highest) yields. For example, 28/53=53%. The Quality of hire formula is helpful for getting an overall value of each source as it averages factors you include. For example, (2/8+5/8)/2=7/16=43%. Cost per hire tells you how much it cost to hire regardless of performance or tenure. For example, 2400/8=$300.For a) Pick the sources which produced the most hires. For b) Pick the source with the best yield ratios for column 5 first, and then column 6. The logic here is that high turnover occurs before performance is appraised so it needs to be factored first. For c) Pick the source with the best yield ratio for column 5. For d) Consider the cost per hire, that is column 7, and pick the sources with the highest costs and lowest yields. Overall recommendations, examine the yield ratios and flag ones which are very low and investigate the causes
4 1 # applicants screened 2 # interviewed 3 # offered Source 7 Total $ cost #accepted 5 # 12-month tenure 6 #above average performance 5 2 40% 53 28 13 8 2400 53% 46% 62% 63% $ 300.00 43% 19 16 12 9 8 4 22500 84% A 75% 89% 50% $2,500 66% 27 14 7 3 1 1 7200 52% 50% 43% B 100% Unsolicited Yield ratio Cost per hire Quality of hire Employee referrals Yield ratio Cost per hire Quality of hire Ads Yield ratio Cost per hire Quality of hire Campus recruiting Yield ratio Cost per hire Quality of hire Job fair Yield ratio Cost per hire Quality of hire C 33% 10 8 6 5 2 1920 80% 75% D 80% 50% E F. 9 3 2 2 1 1 2600 33% 67% 100% 50% 100% $ 1,300.00 G 4 1 # applicants screened 2 # interviewed 3 # offered Source 7 Total $ cost #accepted 5 # 12-month tenure 6 #above average performance 5 2 40% 53 28 13 8 2400 53% 46% 62% 63% $ 300.00 43% 19 16 12 9 8 4 22500 84% A 75% 89% 50% $2,500 66% 27 14 7 3 1 1 7200 52% 50% 43% B 100% Unsolicited Yield ratio Cost per hire Quality of hire Employee referrals Yield ratio Cost per hire Quality of hire Ads Yield ratio Cost per hire Quality of hire Campus recruiting Yield ratio Cost per hire Quality of hire Job fair Yield ratio Cost per hire Quality of hire C 33% 10 8 6 5 2 1920 80% 75% D 80% 50% E F. 9 3 2 2 1 1 2600 33% 67% 100% 50% 100% $ 1,300.00 GStep by Step Solution
There are 3 Steps involved in it

Get step-by-step solutions from verified subject matter experts