

Question: These data come from a Negative Binomial distribution. Write a function to compute the log-likelihood. HINT: You can let log(0) = 0 if required. The
These data come from a Negative Binomial distribution. Write a function to compute the log-likelihood. HINT: You can let log(0) = 0 if required.
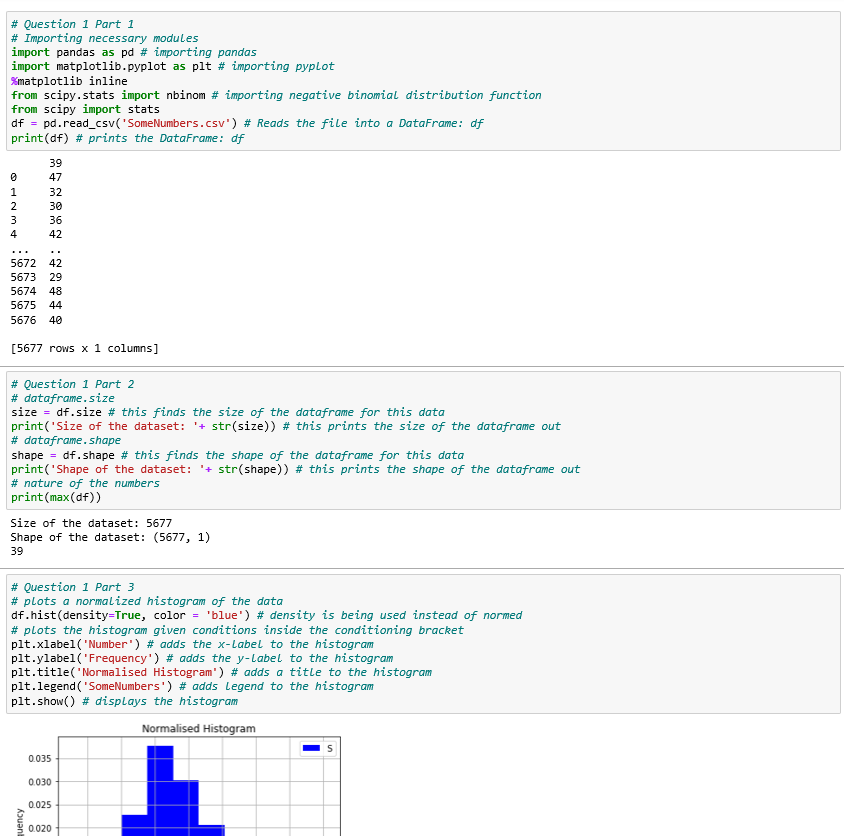
The Negative Binomial distribution has two parameters, N and p. Using your code from part 4, compute the values of log-likelihood for values of N in the range [10-60] and p in the range [0-1] (e.g. use 50 values). Plot your results as a two-dimensional plot with the value of log-likelihood as the colour (or equivalently, make a contour or three dimensional plot). Comment on your results.
Compute the maximum of the log-likelihood and find the best-fit values of N and p. Make a plot of the best-fit distribution on top of the histogram from part 3. Comment on your results.
\f
Step by Step Solution
There are 3 Steps involved in it

Get step-by-step solutions from verified subject matter experts