

Question: These questions all relate to Python. 1 . Which of the following code will plot a histogram graph using a column of a Pandas data
These questions all relate to Python.
Which of the following code will plot a histogram graph using a column of a Pandas data frame? The name of your data frame is dfdata and you want to plot the column named agecolumn nameSelect ALL that apply.
a dfdata.histcolumn'age'
b plthistxdfdata.age
c dfdata.age.hist
d dfdataagehist
You have the following data frame called dfgrapes data frame attached in image that contains data related to the harvest of grapes per region in South Australia. Which of the following code will show you all of the data frame? Select ALL that apply.
a dfgrape.head
b dfgrapes:
c dfgrapes::
d dfgrapes::::
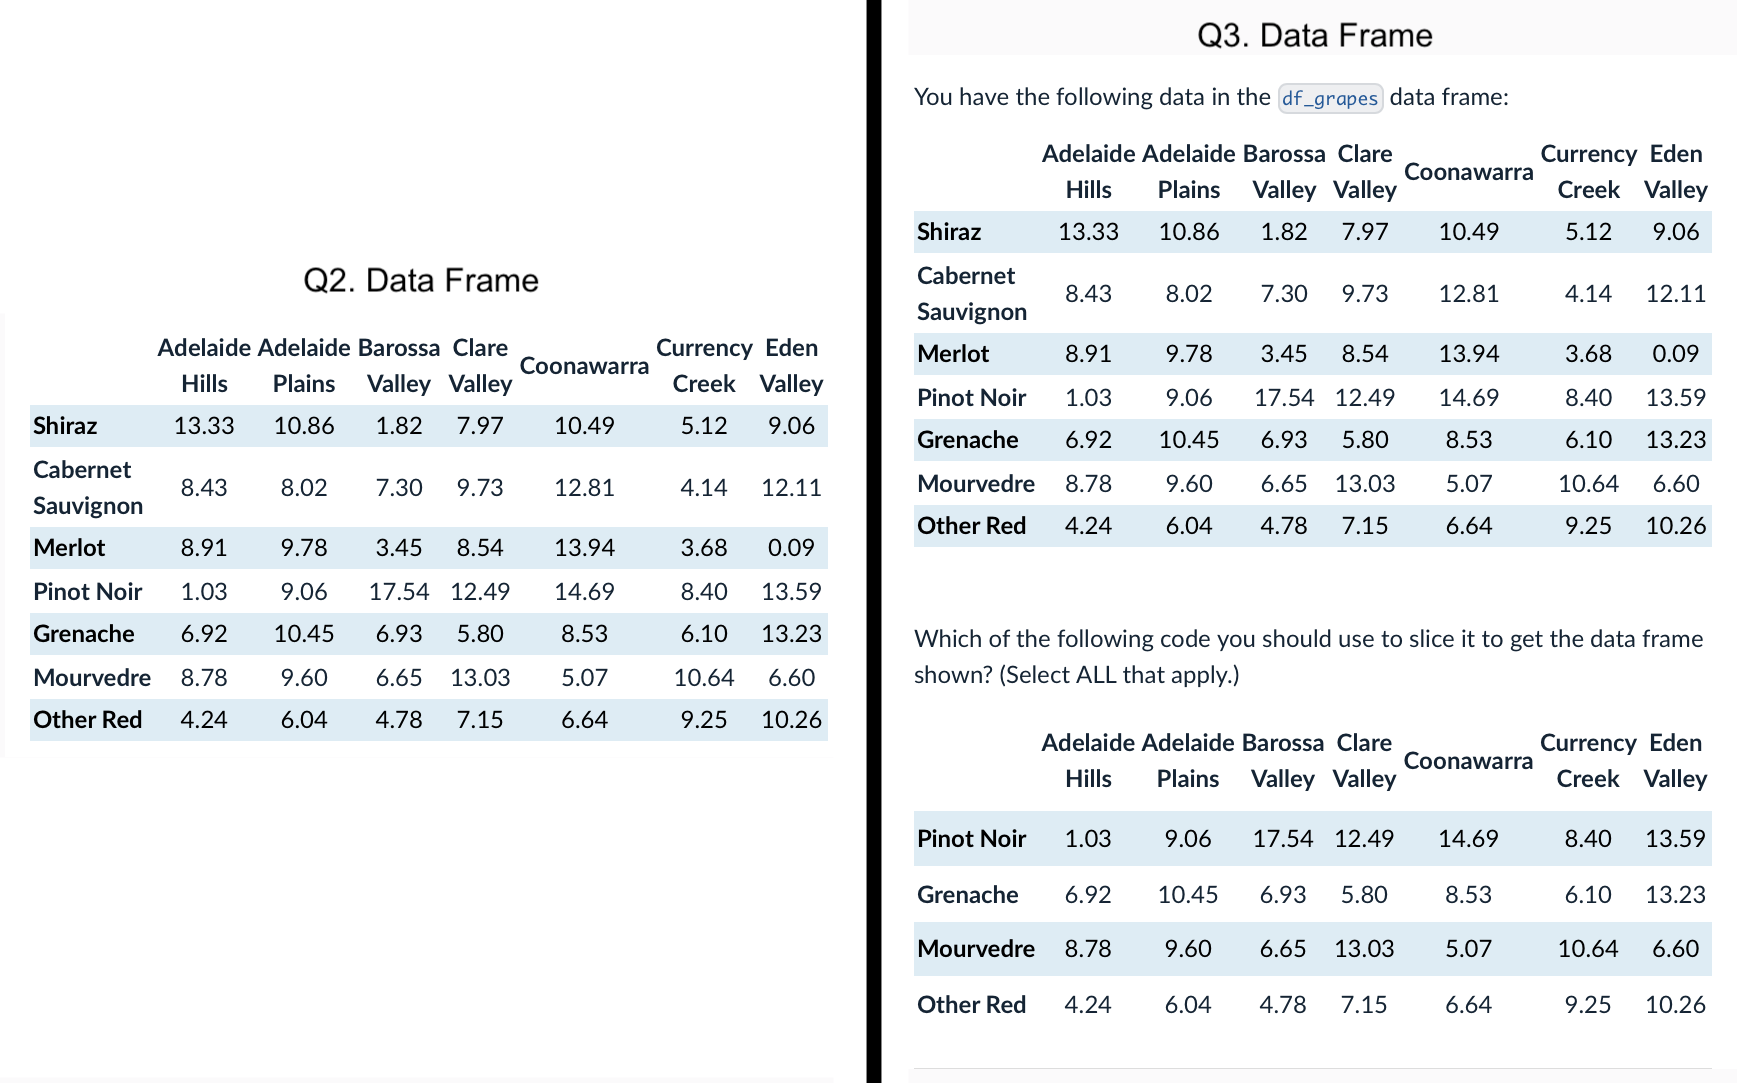
You have the following data in the dfgrapes data frame data frame attached in image:
Which of the following code you should use to slice it to get the data frame shown? Select ALL that apply.
a dfgrapes:
b dfgrapesPinot noir':'Other Red'
c dfgrapes:
d dfgrapes:
When you have missing data in Pandas, what is the default value that Pandas uses to fill the missing data?
a
b NA
c Blank space
d NaN
e
Which of the following combination of functions can count the missing data in a Series or Data Frame? Select ALL that apply.
a isnullcount
b isnasum
c isNaN.count
d isna.count
e isnullsum
Step by Step Solution
There are 3 Steps involved in it
1 Expert Approved Answer
Step: 1 Unlock

Question Has Been Solved by an Expert!
Get step-by-step solutions from verified subject matter experts
Step: 2 Unlock
Step: 3 Unlock