

Question: These statistics problem are giving me grief, I can't get a good handle on them. Please help me out. I apologize for the poor quality
These statistics problem are giving me grief, I can't get a good handle on them. Please help me out. I apologize for the poor quality of the images. It's for questions 2 , 3 and 8 respectively. I can't get a handle on them and have retried every single time.
The Drop Menus for 3 are
1,2,3,6,20 quantitive/qualitative variables which makes up a ____ chart
For 2 it's quantitive , i know this one already
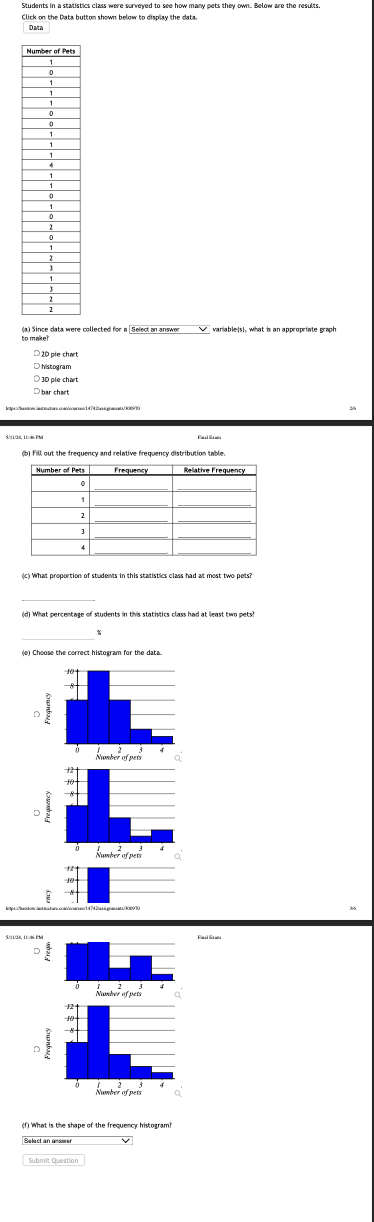
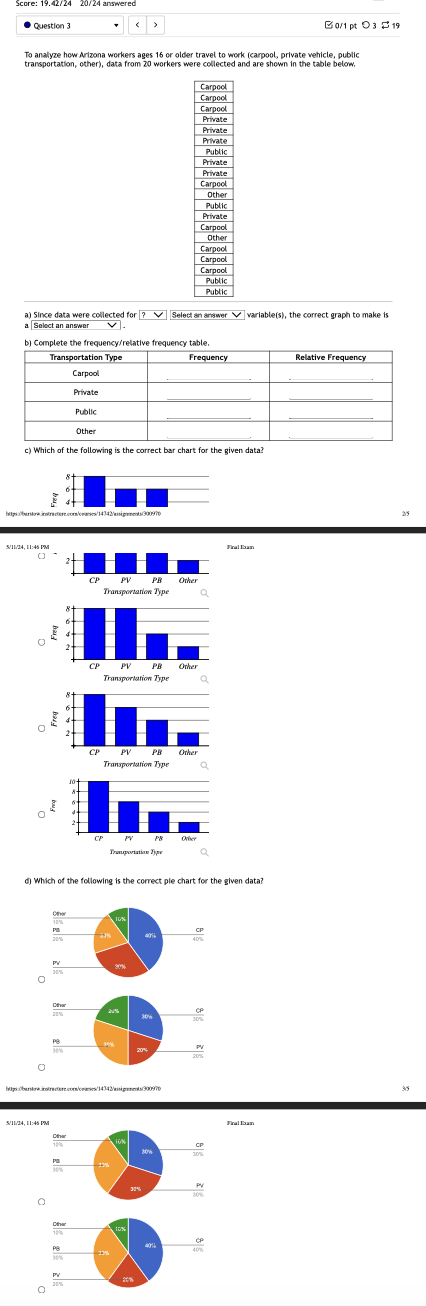
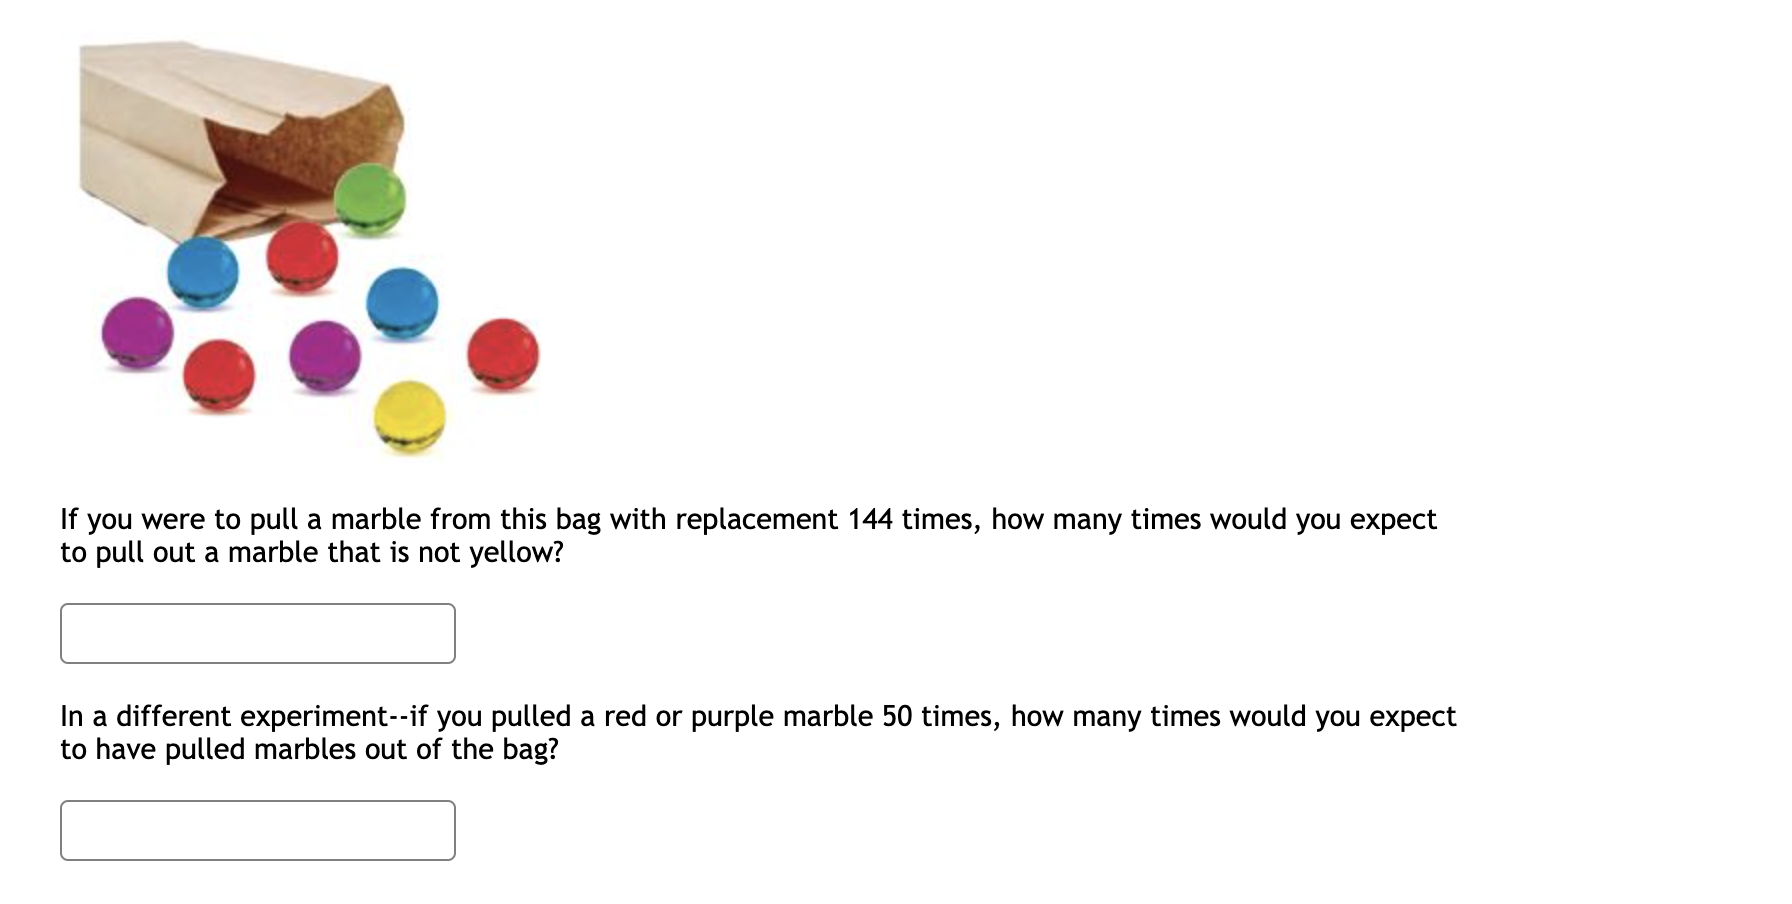
Students In a statistics class were surveyed to see how many pets they own. Below are the results. Click on the Data button shown below to display the data. Data Number of Pets (a) Since data were collected for a Select an answer `variableis), what is an appropriate graph to make 20 pie chart histogram O 10 ple chart Obar chart (5) Fill out the frequency and relative frequency distribution table. Number of Pets Frequency Relative Frequency (c) What proportion of students in this statistics class had at most two pets? "di What percentage of students in this statistics class had at least two pets (e) Choose the correct histogram for the data. Frequency 2 Nowber of pets Q Frequency D Number of pets a Freon Nousher of pets 12 Frequency D November of pets (f) What is the shape of the frequency histogram! Salact an artsmer Submit QuestionScore: 19.42/24 20/24 answered Question 3 Bor pt 0 3 0 19 To analyze how Arizona workers ages 16 or older travel to work (carpool, private vehicle, public transportation, other), data from 20 workers were collected and are shown in the table below. Carpool Carpool Carpool Private Private Private Public Private Private Carpool Other Public Private Carpool Other Carpool Carpool Carpool Public Public a) Since data were collected for ? \\ Select an answer V variable(s), the correct graph to make is Select an answer v. b) Complete the frequency/relative frequency table. Transportation Type Frequency Relative Frequency Carpool Private Public Other c) Which of the following is the correct bar chart for the given data? Free 3/16:/34, 11:45 PM Final Faan PV PR Other Transportation Type Frew PR Other Transportation Type O CP PV Other Transportation Type CP Tranuportatian 1)pr d) Which of the following is the correct pie chart for the given data? PY CP PB 20% PV 5/16/14, 11:45 PM Final Fan CP 37% CP PB PYIf you were to pull a marble from this bag with replacement 144 times, how many times would you expect to pull out a marble that is not yellow? In a different experiment--if you pulled a red or purple marble 50 times, how many times would you expect to have pulled marbles out of the bag
Step by Step Solution
There are 3 Steps involved in it

Get step-by-step solutions from verified subject matter experts