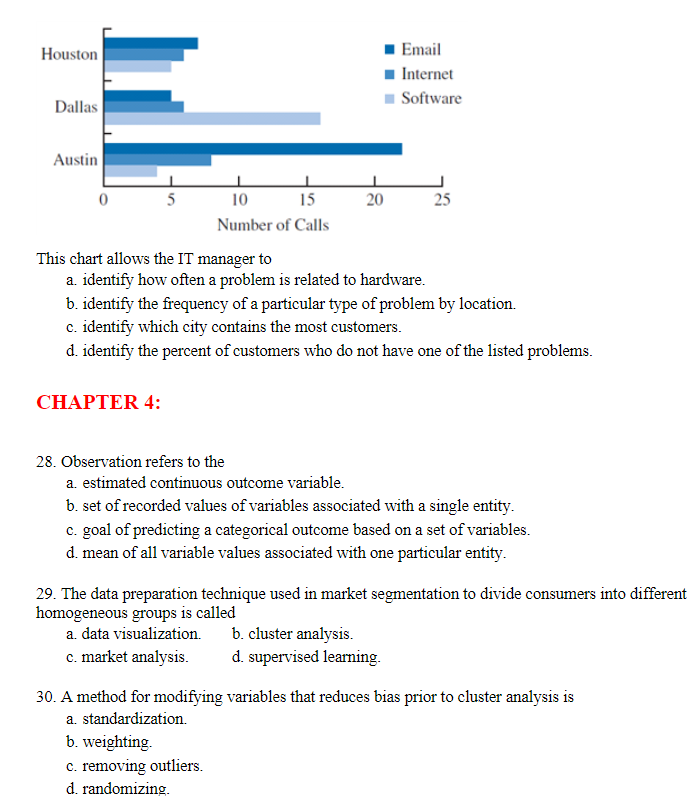
Question: This chart allows the IT manager to a. identify how often a problem is related to hardware. b. identify the frequency of a particular type

This chart allows the IT manager to a. identify

This chart allows the IT manager to a. identify how often a problem is related to hardware. b. identify the frequency of a particular type of problem by location. c. identify which city contains the most customers. d. identify the percent of customers who do not have one of the listed problems. CHAPTER 4: 28. Observation refers to the a. estimated continuous outcome variable. b. set of recorded values of variables associated with a single entity. c. goal of predicting a categorical outcome based on a set of variables. d. mean of all variable values associated with one particular entity. 29. The data preparation technique used in market segmentation to divide consumers into different homogeneous groups is called a. data visualization. b. cluster analysis. c. market analysis. d. supervised learning. 30. A method for modifying variables that reduces bias prior to cluster analysis is a. standardization. b. weighting. c. removing outliers. d. randomizing

Step by Step Solution

There are 3 Steps involved in it

1 Expert Approved Answer
Step: 1 Unlock blur-text-image
Question Has Been Solved by an Expert!

Get step-by-step solutions from verified subject matter experts

Step: 2 Unlock
Step: 3 Unlock

Students Have Also Explored These Related General Management Questions!