

Question: This is a correlation matrix for base pay and bonus pay (as outcome variables) with 3 quantitative predictor variables. perfEval (1.5) seniority (1-5) basePay bonus
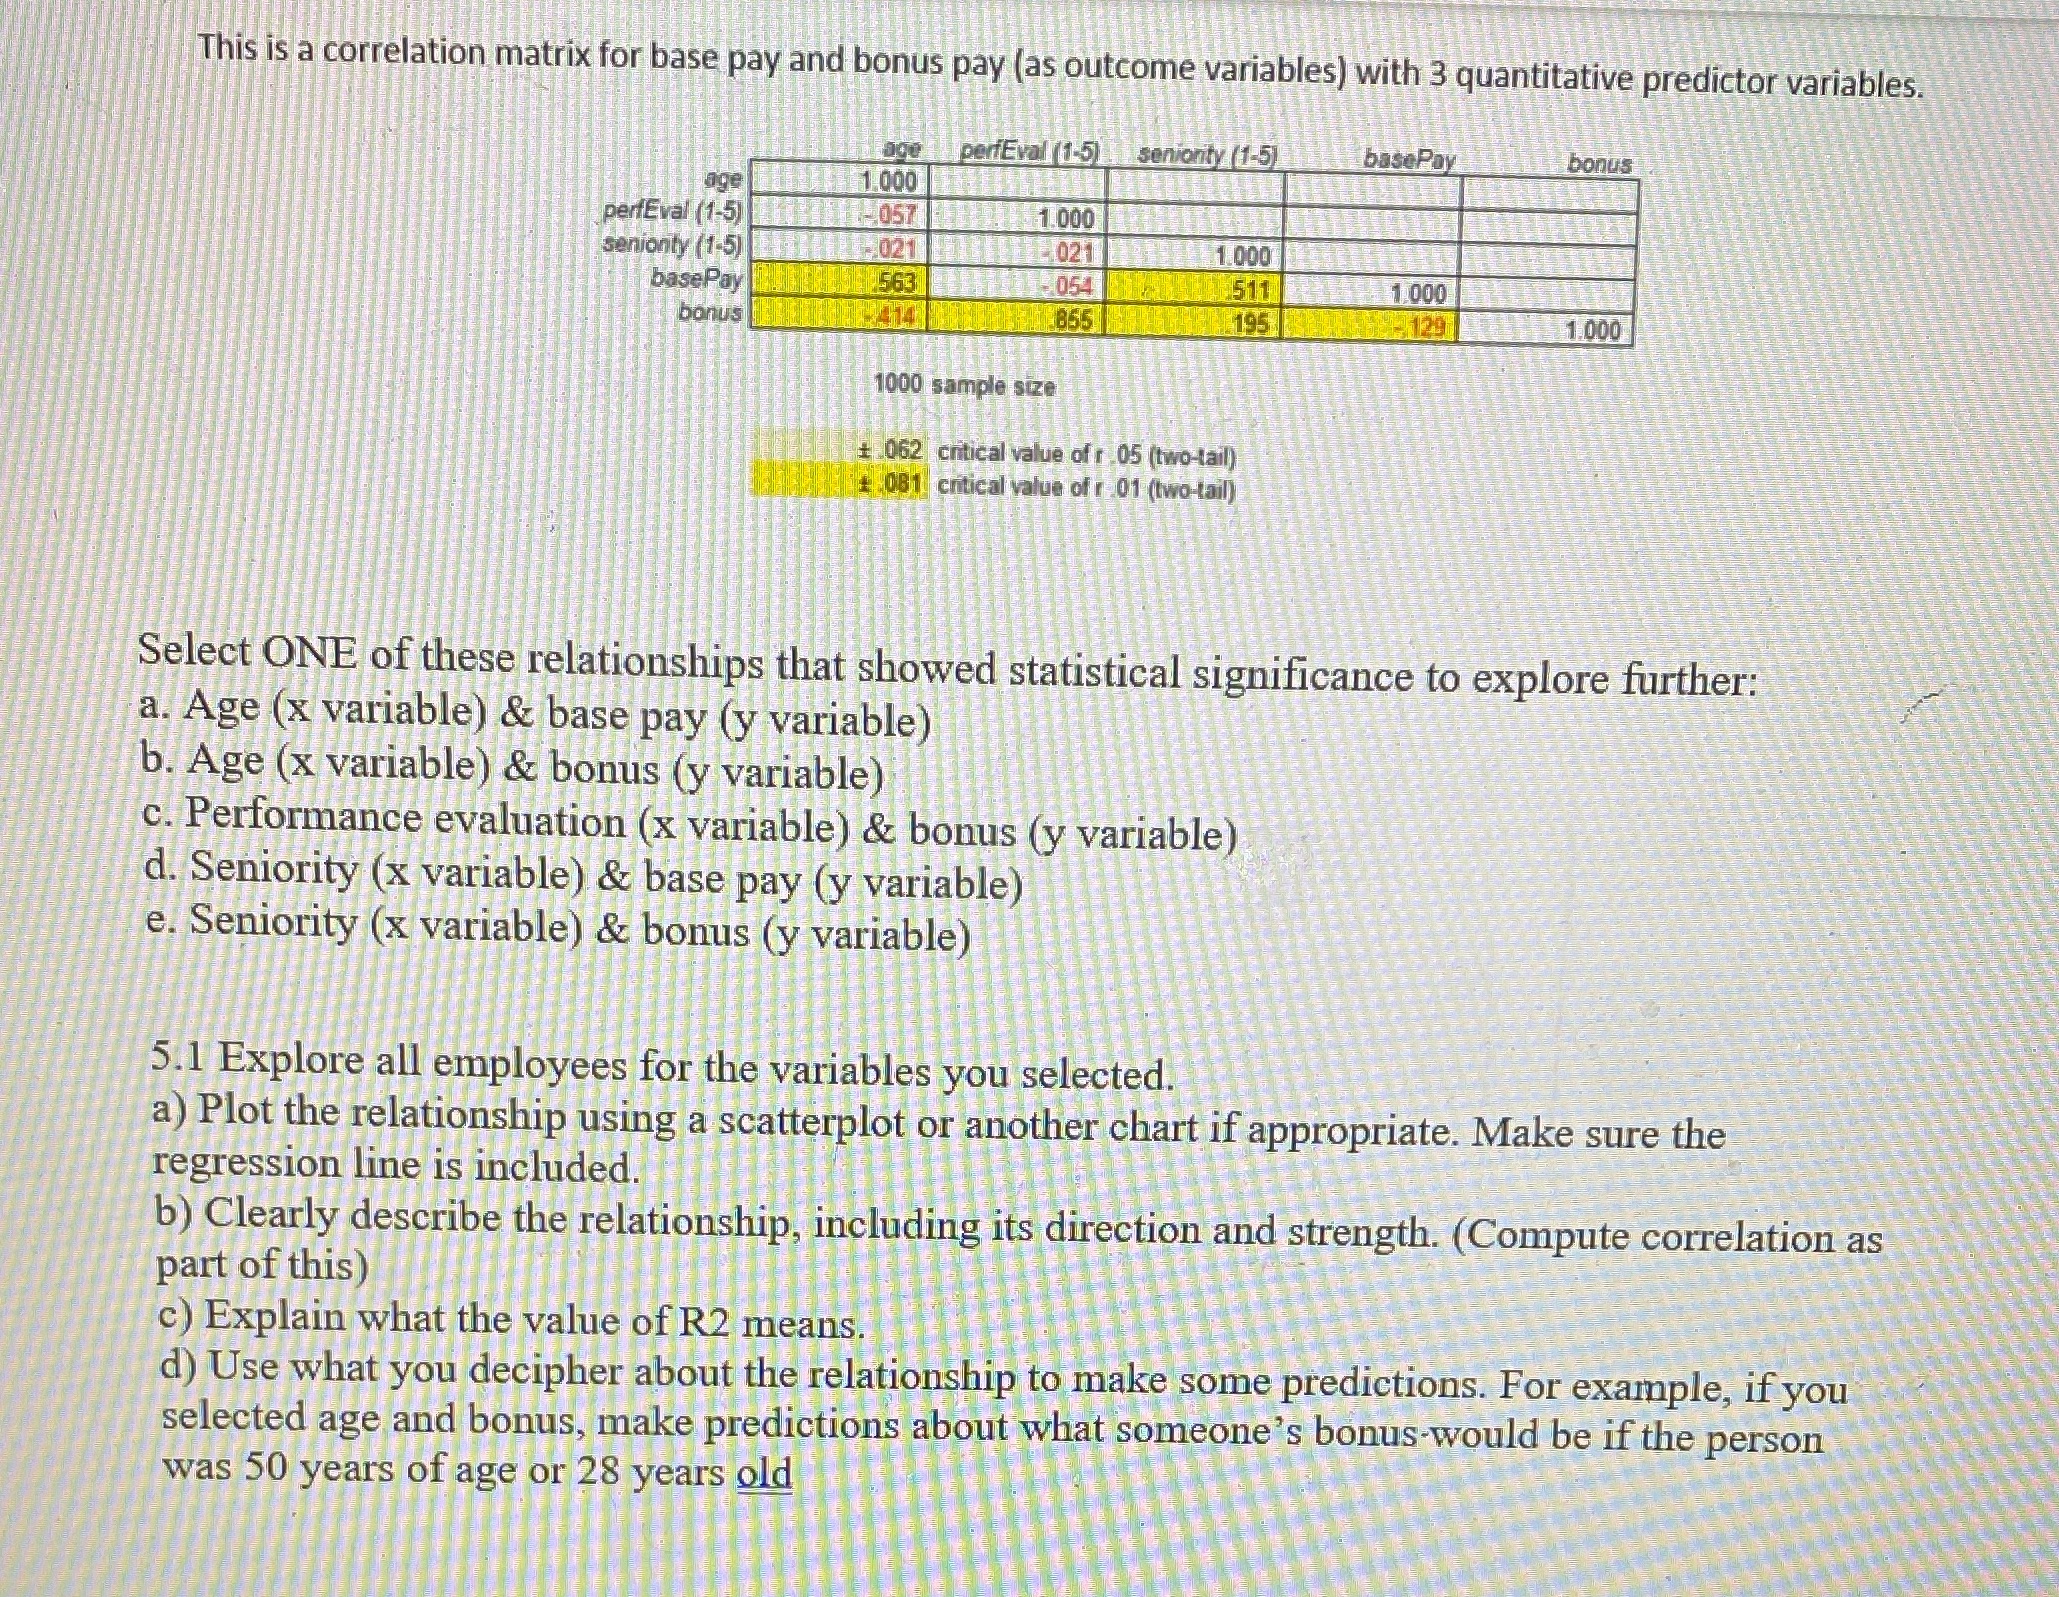
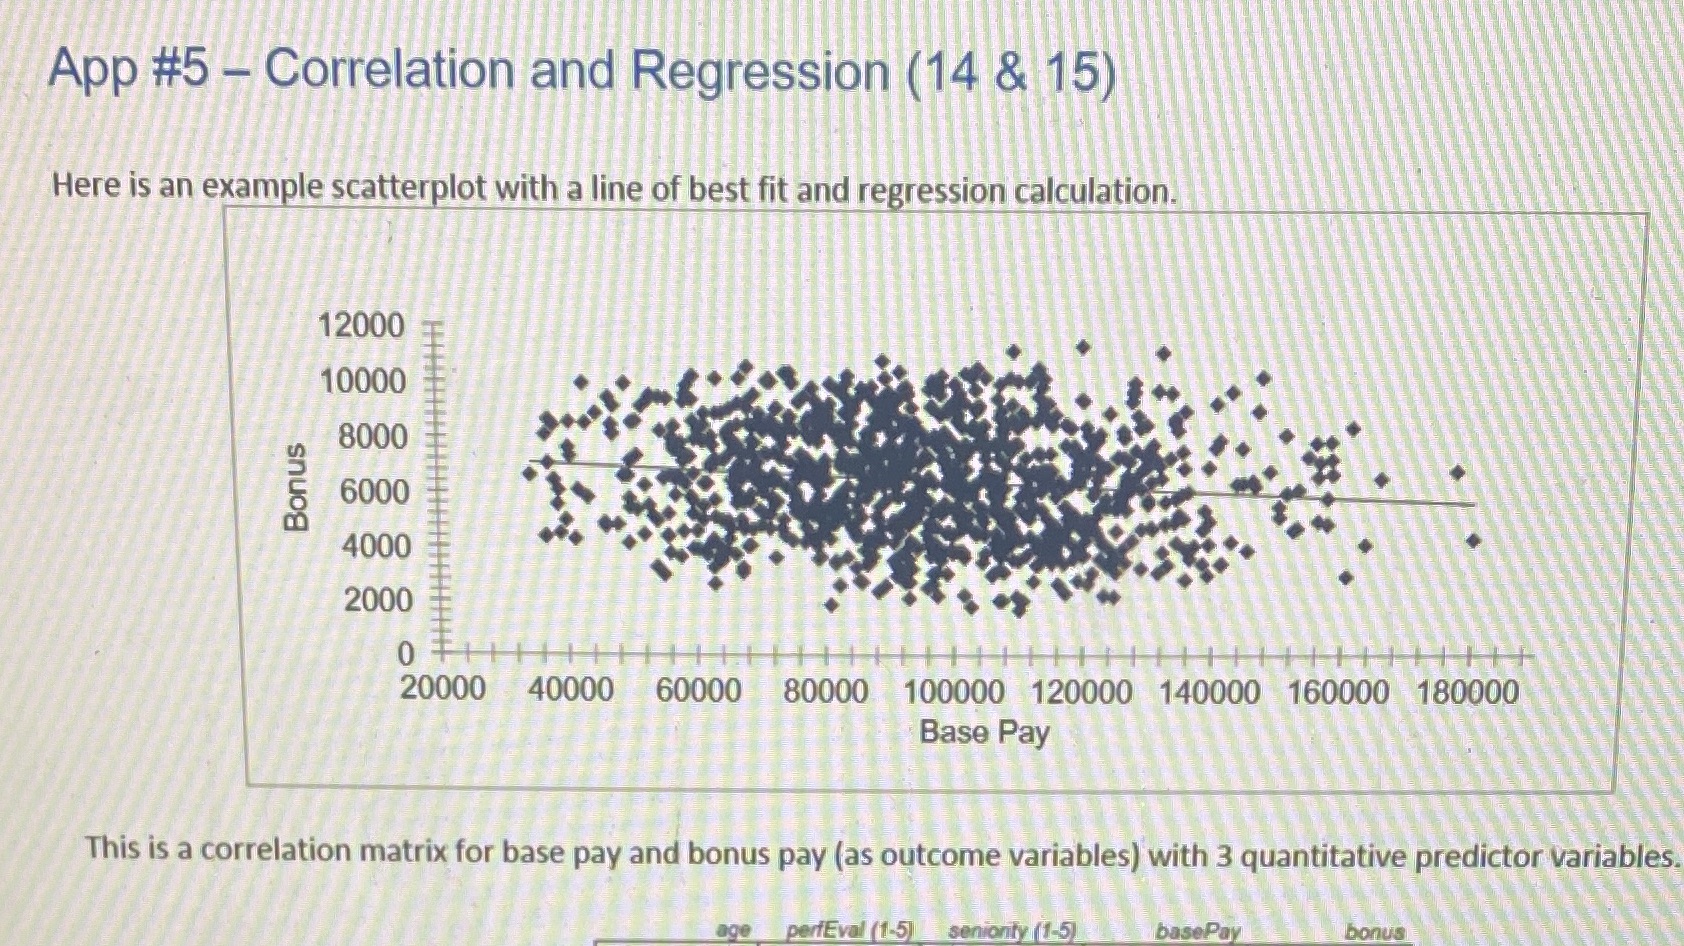
This is a correlation matrix for base pay and bonus pay (as outcome variables) with 3 quantitative predictor variables. perfEval (1.5) seniority (1-5) basePay bonus .000 perfEval (1-5) 1-057 1.000 senionty (1.5) HIGH -021 021 1.000 basePay BUTKEEP 1563 1054 511 1.000 bonus 865 195 1.000 1000 sample size + 062 critical value of r 05 (two-tail) 1051 critical value of r .01 (two-tail) Select ONE of these relationships that showed statistical significance to explore further: a. Age (x variable) & base pay (y variable) b. Age (x variable) & bonus (y variable) c. Performance evaluation (x variable) & bonus (y variable) d. Seniority (x variable) & base pay (y variable) e. Seniority (x variable) & bonus (y variable) 5.1 Explore all employees for the variables you selected. a) Plot the relationship using a scatterplot or another chart if appropriate. Make sure the regression line is included. b) Clearly describe the relationship, including its direction and strength. (Compute correlation as part of this) c) Explain what the value of R2 means. d) Use what you decipher about the relationship to make some predictions. For example, if you selected age and bonus, make predictions about what someone's bonus-would be if the person was 50 years of age or 28 years oldApp #5 - Correlation and Regression (14 & 15) Here is an example scatterplot with a line of best fit and regression calculation. 12000 HIHH 10000 8000 Bonus 6000 4000 2000 0 20000 40000 60000 80000 100000 120000 140000 160000 180000 Base Pay This is a correlation matrix for base pay and bonus pay (as outcome variables) with 3 quantitative predictor variables. age perfEval (1-5) :seniorty (1-5) basePay bonus
Step by Step Solution
There are 3 Steps involved in it

Get step-by-step solutions from verified subject matter experts