

Question: This is a MATLAB based question for Computational Methods and Applications. Please provide clear code with picture of output. Thanks. Model of Virus Spread (25
This is a MATLAB based question for Computational Methods and Applications. Please provide clear code with picture of output. Thanks.
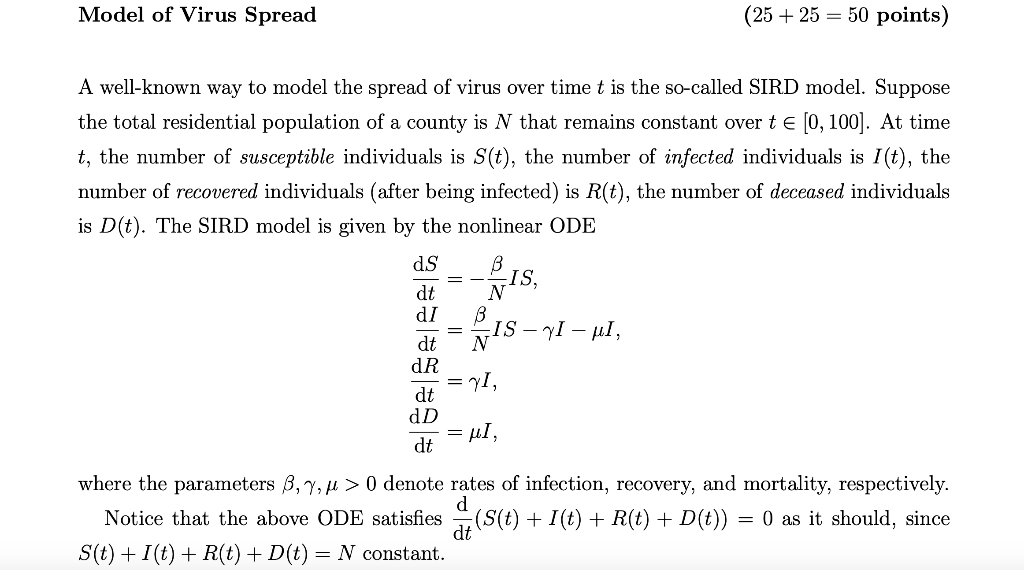
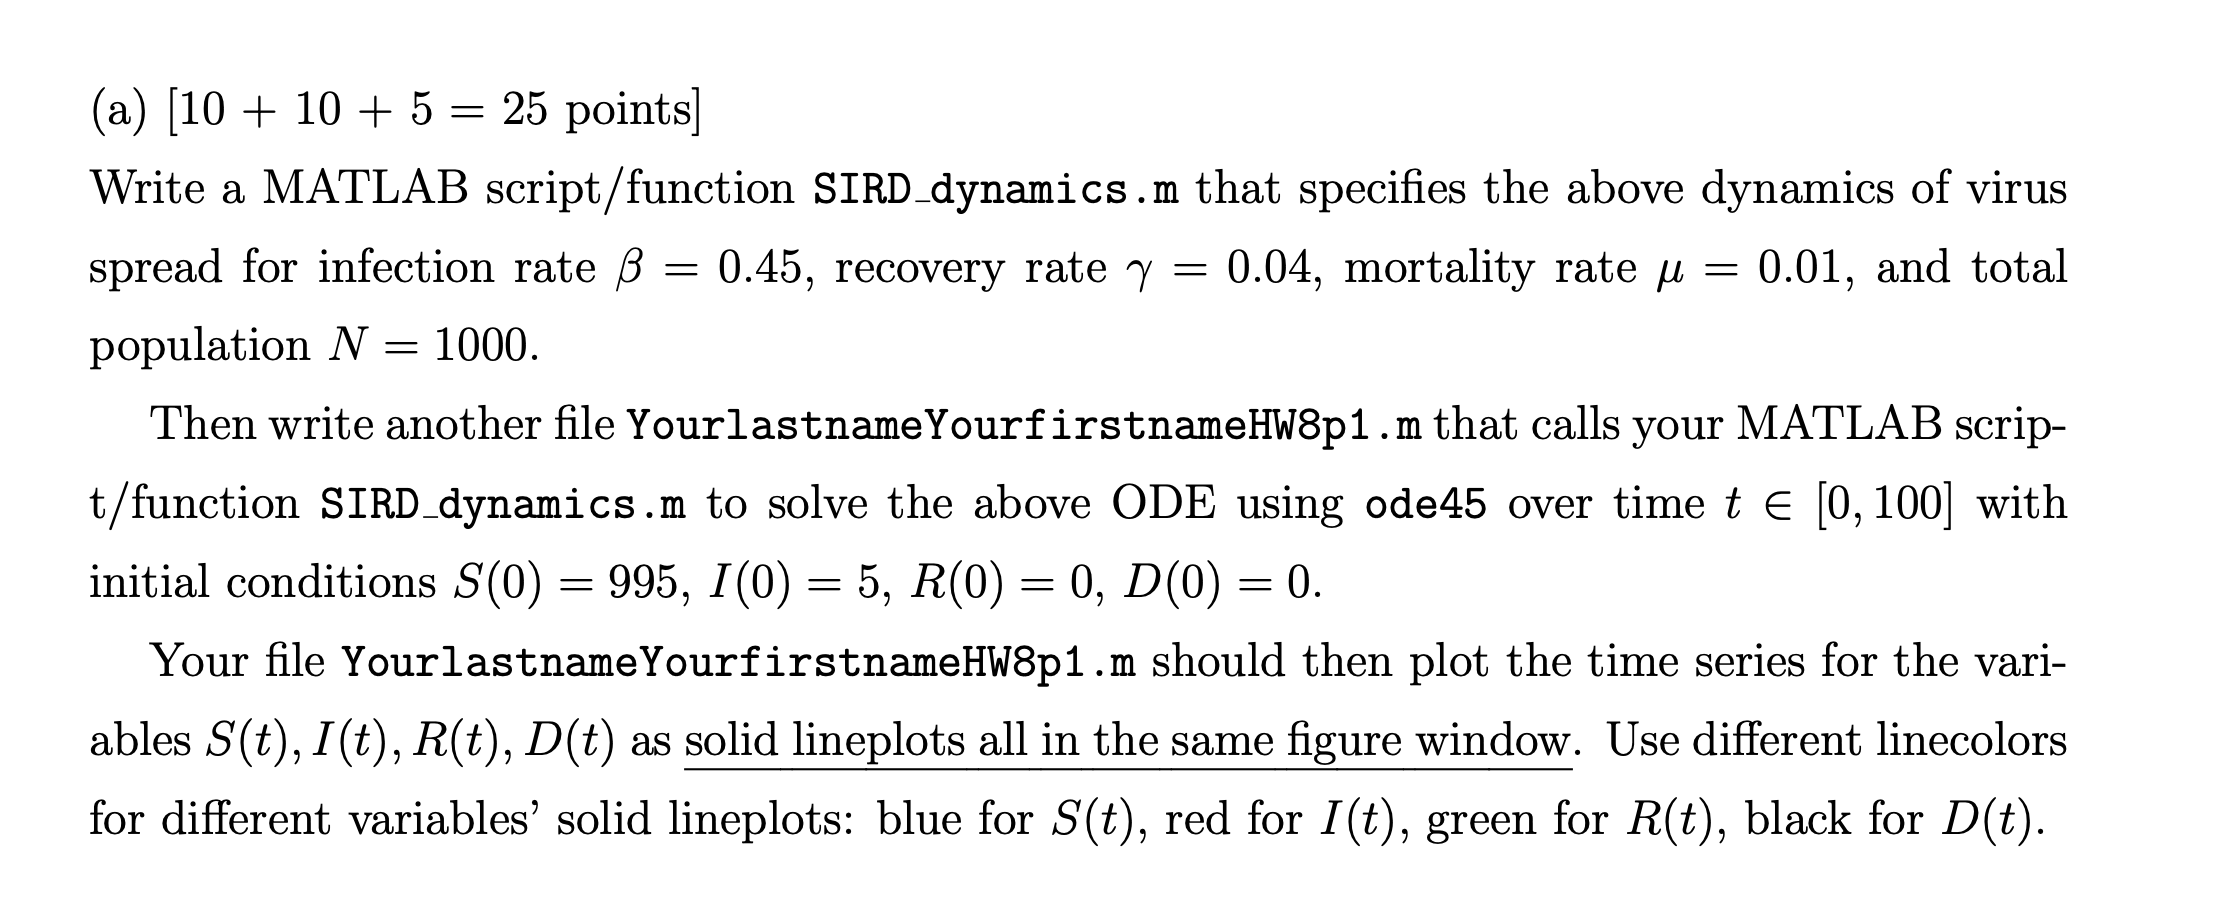
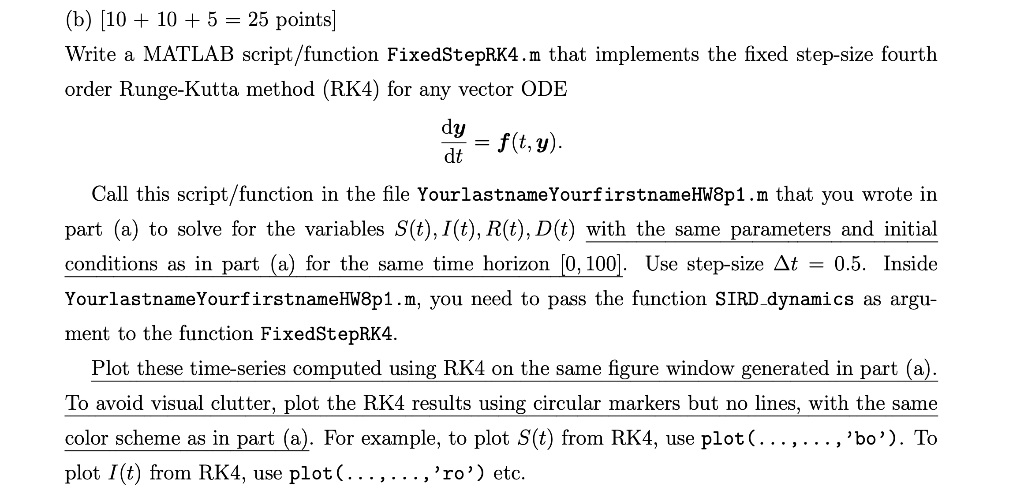
Model of Virus Spread (25 + 25 = 50 points) A well-known way to model the spread of virus over time t is the so-called SIRD model. Suppose the total residential population of a county is N that remains constant over t (0, 100). At time t, the number of susceptible individuals is S(t), the number of infected individuals is I(t), the number of recovered individuals (after being infected) is R(t), the number of deceased individuals is D(t). The SIRD model is given by the nonlinear ODE ds his dt N di B NIS I M1, dt dR = 1, dt dD = , dt = where the parameters 8,741 > 0 denote rates of infection, recovery, and mortality, respectively. = 0 as it should, since S(t) +I(t) + R(t) + D(t) = N constant. Notice that the above ODE satisfies I (S(t) + ](6) + R(t) + D(t)) = (a) [10 + 10 + 5 = 25 points] Write a MATLAB script/function SIRD_dynamics.m that specifies the above dynamics of virus spread for infection rate B 0.45, recovery rate y = 0.04, mortality rate u = 0.04, mortality rate u = 0.01, and total population N = 1000. Then write another file Yourlastname Yourfirstname HW8p1.m that calls your MATLAB scrip- t/function SIRD_dynamics.m to solve the above ODE using ode45 over time t e [0, 100) with initial conditions S(0) = 995, I(0) = 5, R(0) = 0, D(0) = Your file YourlastnameYourfirstname HW8p1.m should then plot the time series for the vari- ables S(t), I(t), R(t), D(t) as solid lineplots all in the same figure window. Use different linecolors for different variables' solid lineplots: blue for S(t), red for I(t), green for R(t), black for D(t). (b) (10 + 10 + 5 = 25 points) Write a MATLAB script/function FixedStepRK4.m that implements the fixed step-size fourth order Runge-Kutta method (RK4) for any vector ODE dy f(t, y). dt = Call this script/function in the file Yourlastname Yourfirstname HW8p1.m that you wrote in part (a) to solve for the variables S(t), I(t), R(t), D(t) with the same parameters and initial conditions as in part (a) for the same time horizon [0, 100). Use step-size At = 0.5. Inside Yourlastname Yourfirstname HW8p1.m, you need to pass the function SIRD dynamics as argu- ment to the function FixedStepRK4. Plot these time-series computed using RK4 on the same figure window generated in part (a). To avoid visual clutter, plot the RK4 results using circular markers but no lines, with the same color scheme as in part (a). For example, to plot S(t) from RK4, use plot(...,...,'bo'). To plot 1(t) from RK4, use plot(...,..., 'ro') etc
Step by Step Solution
There are 3 Steps involved in it

Get step-by-step solutions from verified subject matter experts