

Question: This is a problem I am experiencing in my Math453-concepts in design of exp. class and am struggling to figure this out. The problem I
This is a problem I am experiencing in my Math453-concepts in design of exp. class and am struggling to figure this out. The problem I am having is doing this problem in a ONE-WAY ANOVA..
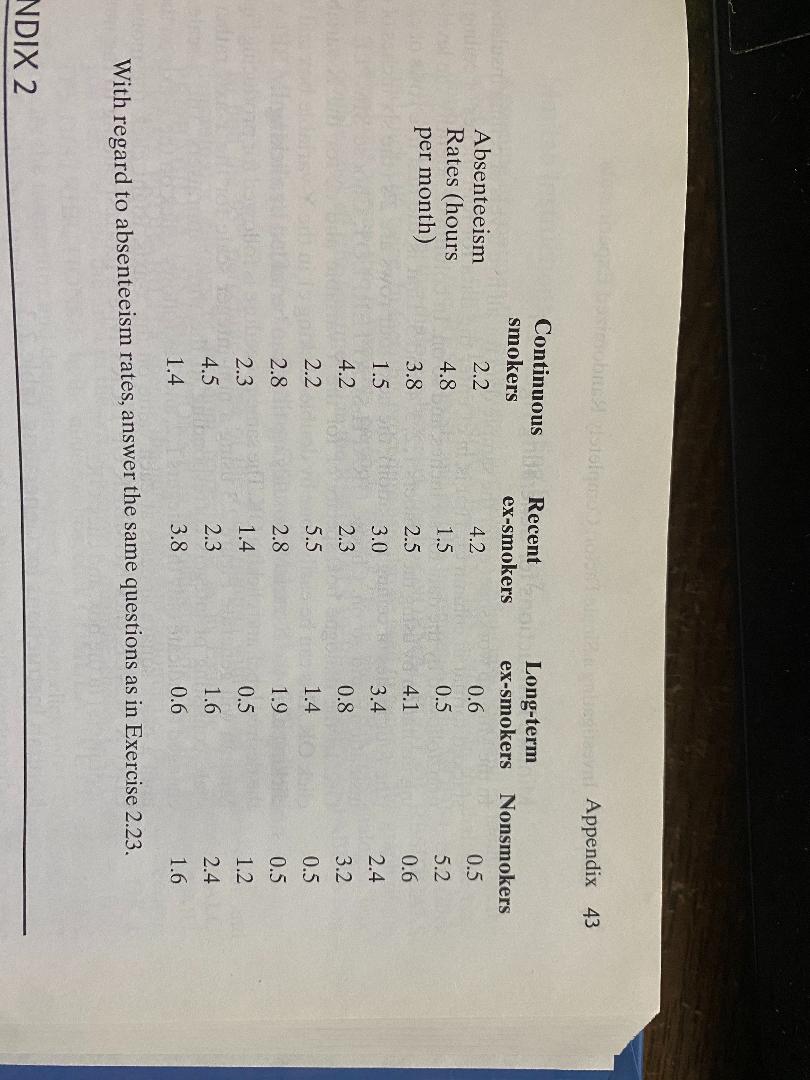
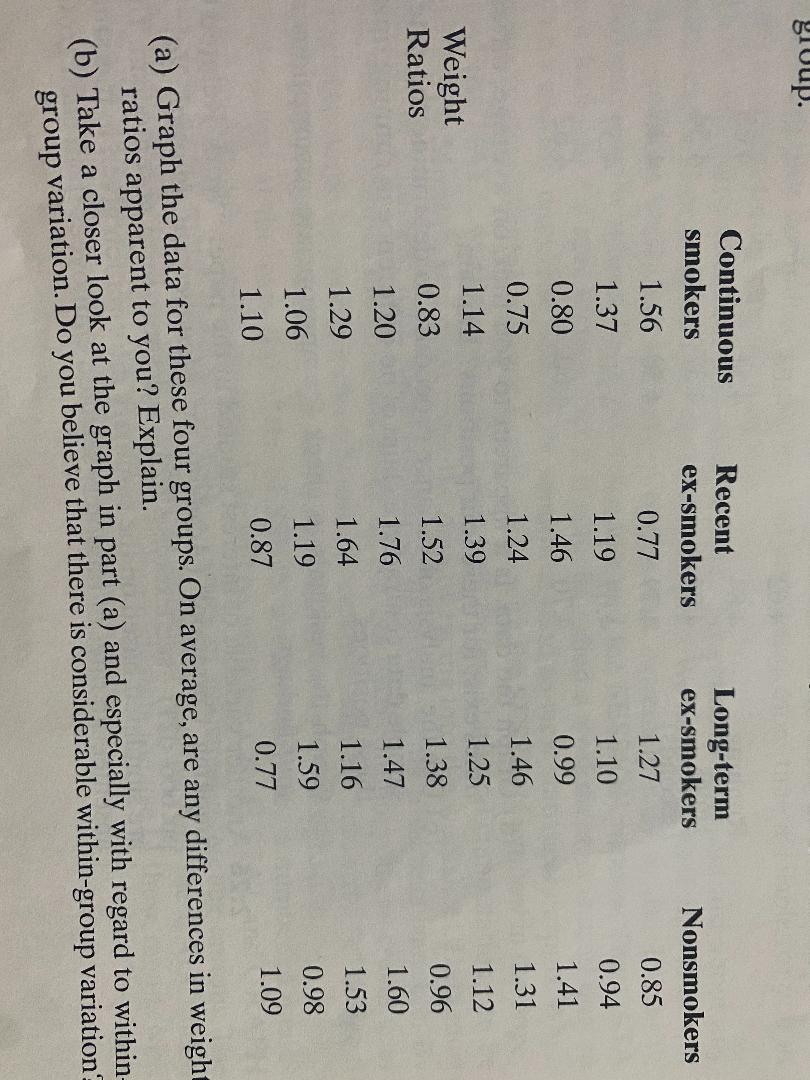
(c) Graph the residuals to check for appropriate assumptions and comment on your findings. 2.26 Another variable of interest studied in the paper "Work-Related Consequences of Smoking Cessation" (Academy of Management Journal, Vol. 32, No. 3, 1989, pp. 606-621)-see Exercise 2.23-was short-term absenteeism. The following data are simulated based on the summary information given in this study and represent absenteeism rates of randomly selected employees from each group.blamebestjasyn Appendix 43 Continuous Recent smokers Long-term ex-smokers Absenteeism 2.2 ex-smokers Nonsmokers Rates (hours 4.2 0.6 0.5 4.8 per month) 1.5 0.5 5.2 3.8 2.5 4.1 0.6 1.5 3.0 3.4 2.4 4.2 2.3 0.8 3.2 2.2 5.5 1.4 0.5 2.8 2.8 1.9 0.5 2.3 1.4 0.5 1.2 4.5 2.3 1.6 2.4 1.4 3.8 0.6 1.6 With regard to absenteeism rates, answer the same questions as in Exercise 2.23. NDIX 2(a) Graph the data for these four groups. On average, are any differences in weight ratios apparent to you? Explain. (b) Take a closer look at the graph in part (a) and especially with regard to within- group variation. Do you believe that there is considerable within-group variation?Investigating a Single Factor: Completely Randomized Experiments If yes, what source or sources might be causing this within-group variation? Explain. (c) Use the appropriate analysis of variance procedure to determine the extent to which these sample data contradict a claim of no difference in weight ratios, on average, for these four groups. Support your answer. (d) In view of your answer to part (b), might you have some difficulty with the answer in part (c)? Explain. (e) Graph the residuals to check for appropriate assumptions and comment on your findings.group. Continuous Recent smokers Long-term ex-smokers ex-smokers Nonsmokers 1.56 0.77 1.27 0.85 1.37 1.19 1.10 0.94 0.80 1.46 0.99 1.41 0.75 1.24 1.46 1.31 Weight 1.14 1.39 1.25 1.12 Ratios 0.83 1.52 1.38 0.96 1.20 1.76 1.47 1.60 1.29 1.64 1.16 1.53 1.06 1.19 1.59 0.98 1.10 0.87 0.77 1.09 (a) Graph the data for these four groups. On average, are any differences in weight ratios apparent to you? Explain. (b) Take a closer look at the graph in part (a) and especially with regard to within group variation. Do you believe that there is considerable within-group variation
Step by Step Solution
There are 3 Steps involved in it

Get step-by-step solutions from verified subject matter experts