

Question: This is a repost as the previous expert's answer did not help to solve the task. Having trouble writing the code to execute the following
This is a repost as the previous expert's answer did not help to solve the task.
Having trouble writing the code to execute the following tasks:
Determine the correlation for the following categories or groups of variables and it's relation to the progression or nonprogression of clinical trials:
(we can use heat maps and any other appropriate correlation analysis as needed)
1. Industry sponsored vs. non-industry sponsored trials 3. Sex inclusive trials vs. sex specific trials 4. Rare cancer trials vs. common cancer trials
See the images below for the data info. Do I need to change the data type to run a correlation? Please let me know the python code to find the correlation between these categories and run a heat map. Also, see the key error in the last image below. How do I go about fixing this key error?
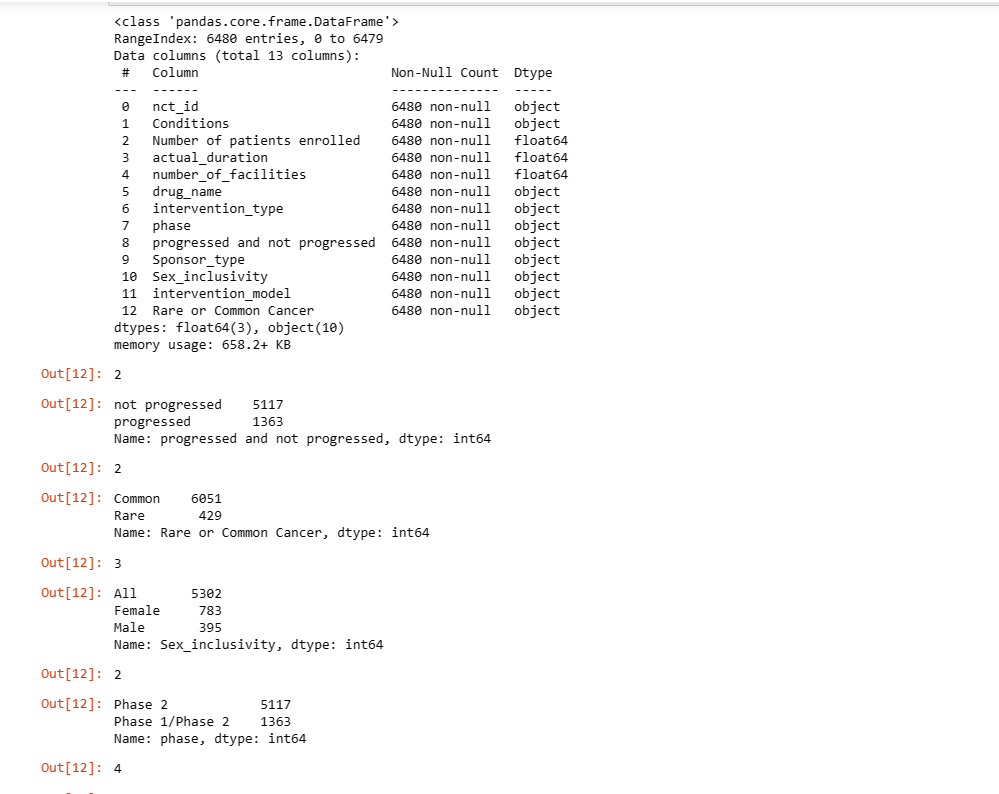
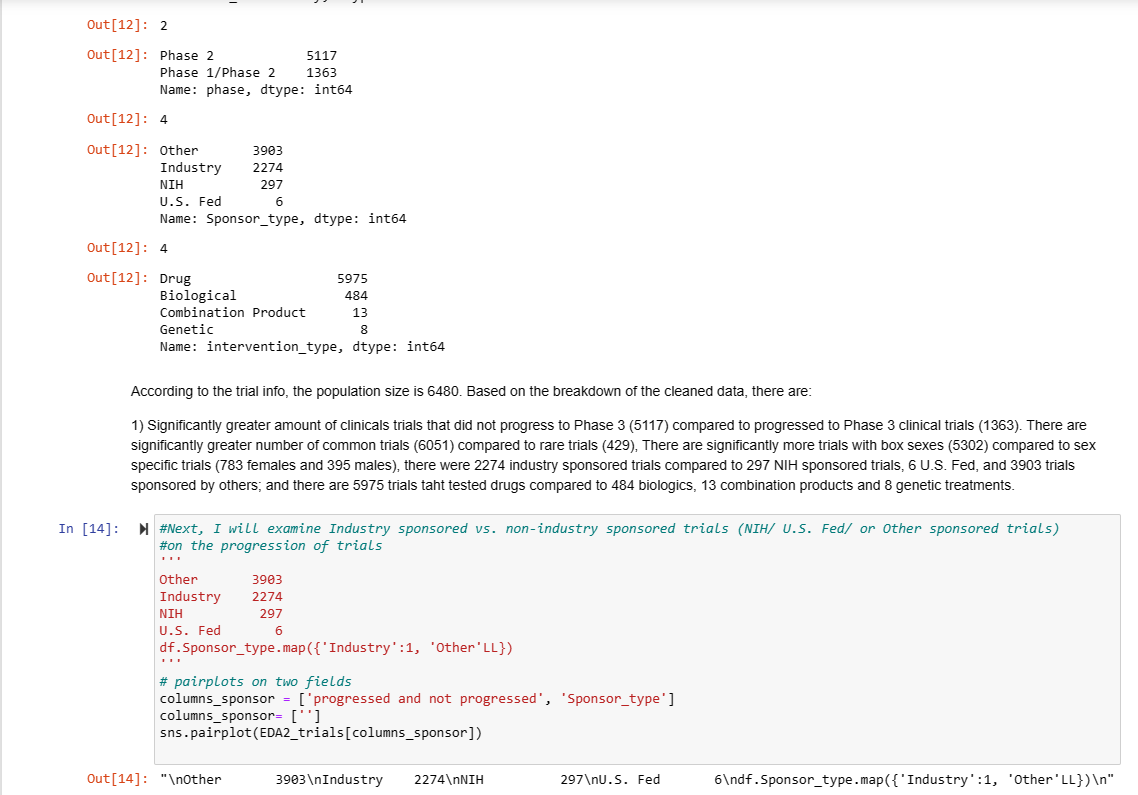
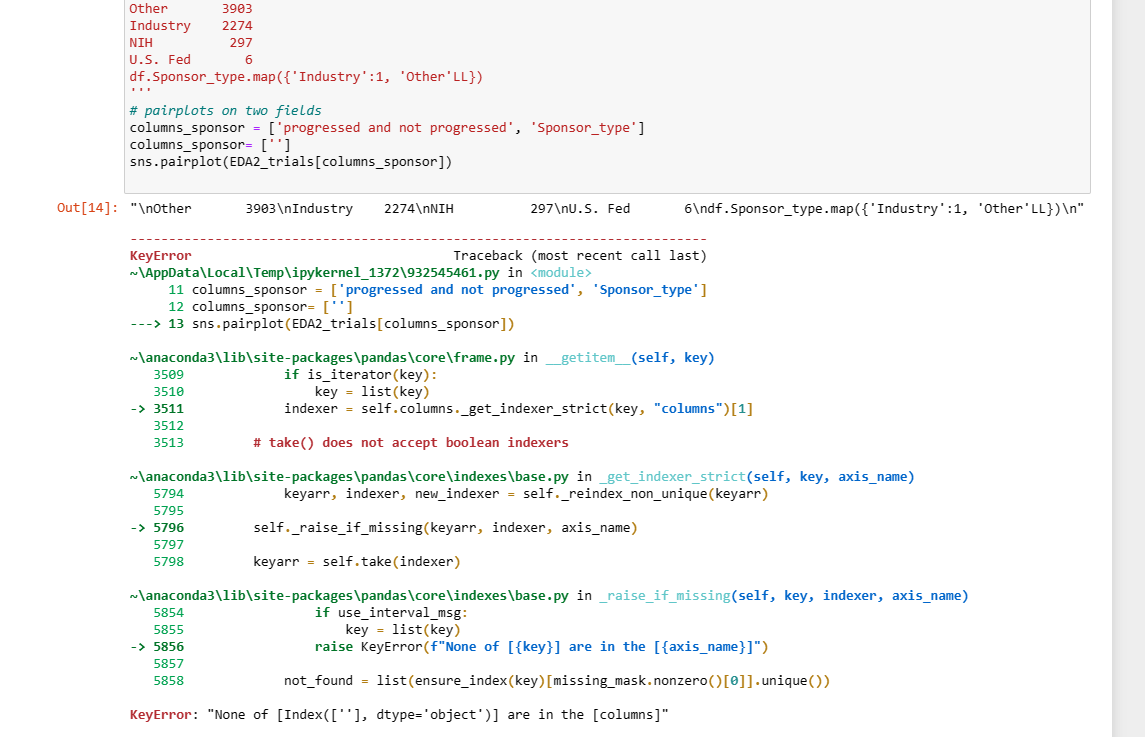
According to the trial info, the population size is 6480 . Based on the breakdown of the cleaned data, there are: 1) Significantly greater amount of clinicals trials that did not progress to Phase 3 (5117) compared to progressed to Phase 3 clinical trials (1363). There are significantly greater number of common trials (6051) compared to rare trials (429), There are significantly more trials with box sexes (5302) compared to sex specific trials (783 females and 395 males), there were 2274 industry sponsored trials compared to 297 NIH sponsored trials, 6 U.S. Fed, and 3903 trials sponsored by others; and there are 5975 trials taht tested drugs compared to 484 biologics, 13 combination products and 8 genetic treatments. M \#Next, I will examine Industry sponsored vs. non-industry sponsored trials (NIH/ U.S. Fed/ or Other sponsored trials) \#on the progression of trials Other 3903 Industry 2274 NIHU.S.Fed2976 df.Sponsor_type.map( { 'Industry':1, 'Other 'LL }) \# pairplots on two fields columns_sponsor = ['progressed and not progressed', 'Sponsor_type'] columns_sponsor =[ " ] sns.pairplot(EDA2_trials[columns_sponsor])
Step by Step Solution
There are 3 Steps involved in it

Get step-by-step solutions from verified subject matter experts