

Question: This is a second half question. Your company is setting up X-bar and R-charts to control a process. In preparation, a total of 20 samples
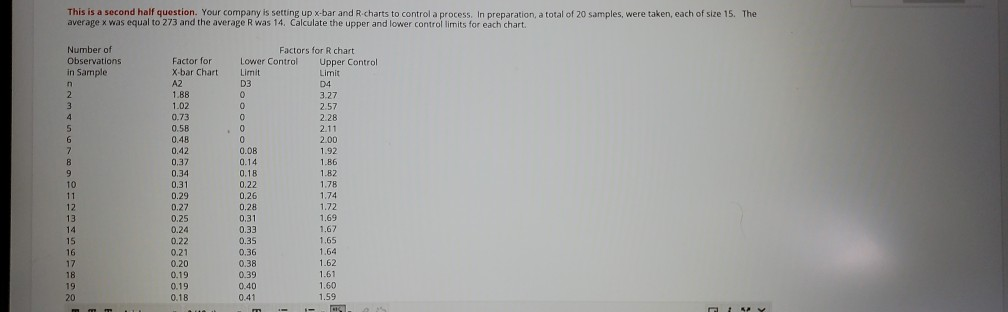
This is a second half question. Your company is setting up X-bar and R-charts to control a process. In preparation, a total of 20 samples were taken, each of size 15. The average x was equal to 273 and the average Rwas 14. Calculate the upper and lower control limits for each chart. Limit Number of Observations in Sample n 2 3 4 5 6 7 9 TO 11 12 13 14 15 16 17 18 19 20 Factor for X-bar Chart A2 1.BB 1.02 0.73 0.58 0.48 0.42 0.37 0.34 0.31 0.29 0.27 0.25 0.24 0.22 0.21 0.20 0.19 0.19 0.18 Factors for R chart Lower Control Upper Control Limit D3 04 O 3.27 0 2.57 0 2.28 0 2.11 0 2.00 0.08 1.92 0.14 1.86 0.18 1.82 0.22 1.78 0.26 1.74 0.28 1.72 0.31 1.69 0.33 1.67 0.35 1.65 0.36 1.64 0.38 1.62 0.39 1.61 0.40 1.60 0.41 1.59 SY
Step by Step Solution
There are 3 Steps involved in it
1 Expert Approved Answer
Step: 1 Unlock

Question Has Been Solved by an Expert!
Get step-by-step solutions from verified subject matter experts
Step: 2 Unlock
Step: 3 Unlock