

Question: This is an example of Exponential Smoothing with Trend Adjustment. The goal is to compute an exponentially smoothed average to adjust inventory (+/-) to account
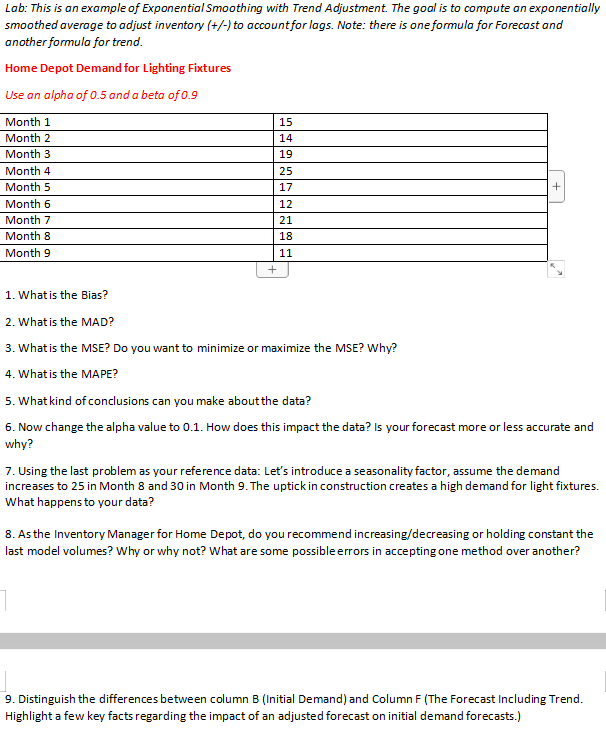
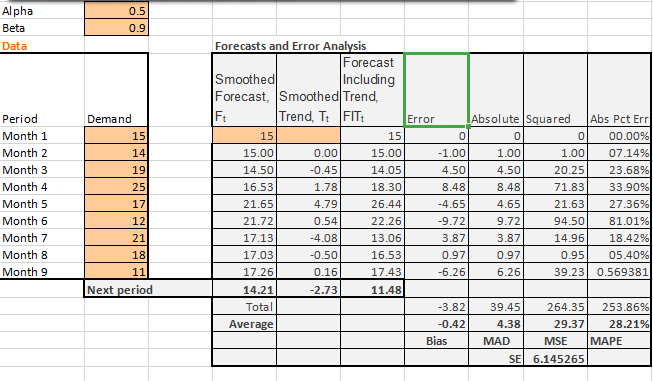
This is an example of Exponential Smoothing with Trend Adjustment. The goal is to compute an exponentially smoothed average to adjust inventory (+/-) to account for lags. Note: there is one formula for Forecast and another formula for trend.
Step by Step Solution
There are 3 Steps involved in it
1 Expert Approved Answer
Step: 1 Unlock

Question Has Been Solved by an Expert!
Get step-by-step solutions from verified subject matter experts
Step: 2 Unlock
Step: 3 Unlock