

Question: This is for a Human resource Management class. I need help interpreting the data to answer the questions at the end of the case study.
This is for a Human resource Management class. I need help interpreting the data to answer the questions at the end of the case study. Will you please help me with the step by step answer to questions 1-4. Thank you.
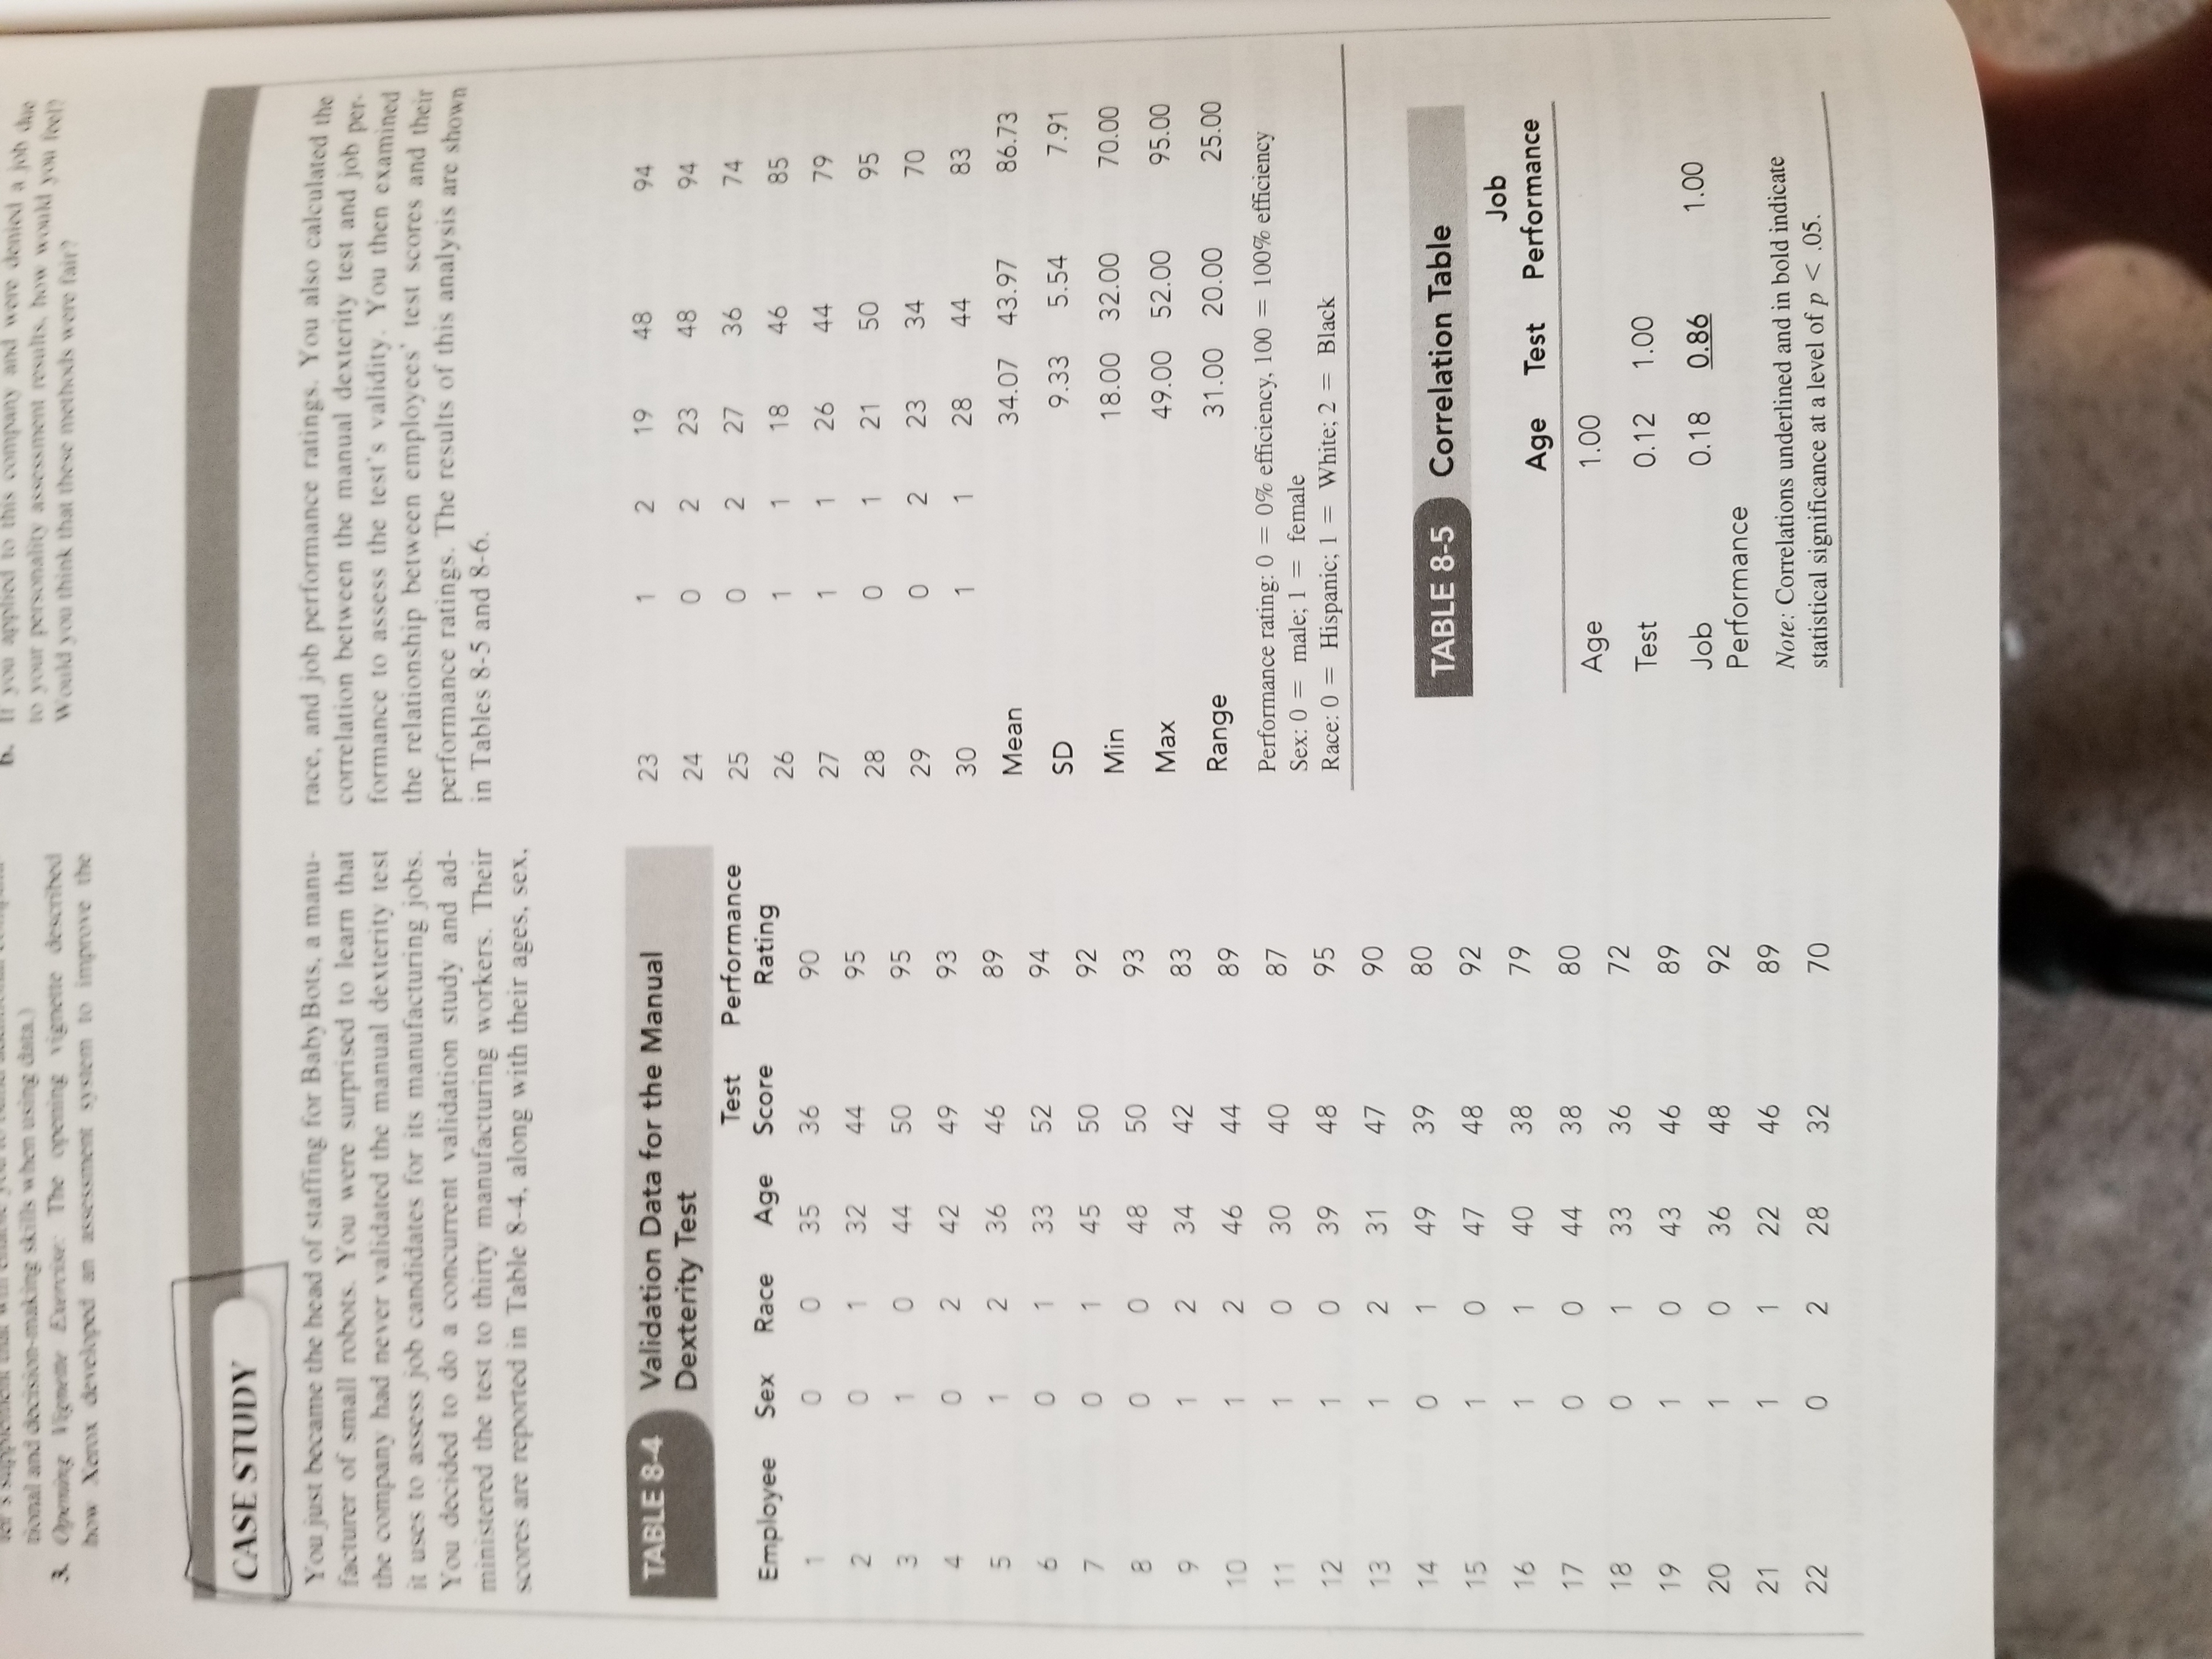
tional and decision-making skills when using data. ) If you apphed to this company and were denied a job de & Opening Mememe Exercise: The opening vignette described to your personality assessment results, how would you feel how Xerox developed an assessment s system to improve the Would you think that these methods were fair? CASE STUDY You just became the head of staffing for BabyBots, a manu- facturer of small robots. You were surprised to learn that race, and job performance ratings. You also calculated the the company had never validated the manual dexterity test correlation between the manual dexterity test and job per- it uses to assess job candidates for its manufacturing jobs. formance to assess the test's validity. You then examined You decided to do a concurrent validation study and ad- the relationship between employees' test scores and their ministered the test to thirty manufacturing workers. Their performance ratings. The results of this analysis are shown in Tables 8-5 and 8-6. scores are reported in Table 8-4, along with their ages, sex. TABLE 8-4 Validation Data for the Manual 23 48 94 Dexterity Test O NNN 48 94 Test Performance O 36 74 Employee Sex Race Age Score Rating NOMN 46 O O 35 36 85 8 O 32 44 44 79 95 -4 O 50 95 O 44 50 95 29 O N 23 34 70 O N 93 30 28 44 83 N Mean 34.07 43.97 86.73 O SD 9.33 5.54 7.91 O Min 18.00 32.00 70.00 O O Max 49.00 52.00 95.00 -1 N Range 31.00 20.00 25.00 Performance rating: 0 = 0% efficiency, 100 = 100% efficiency OON 95 Sex: 0 = male; 1 = female -1 Race: 0 = Hispanic; 1 = White; 2 = Black N 90 O 80 Correlation Table O 48 92 TABLE 8-5 38 79 Job 9 8 Age Test Performance O O 38 80 36 72 Age 1.00 O O 46 89 Test 0.12 1.00 48 92 Job 0.18 0.86 1.00 O 89 Performance Note: Correlations underlined and in bold indicate O N 32 70 statistical significance at a level of p
Step by Step Solution
There are 3 Steps involved in it

Get step-by-step solutions from verified subject matter experts