

Question: THIS IS FOR STATISTICS THANK YOU :) Instructions: Please answer these questions using EXCEL. If you don't use EXCEL you will not get any points.
THIS IS FOR STATISTICS
THANK YOU :)
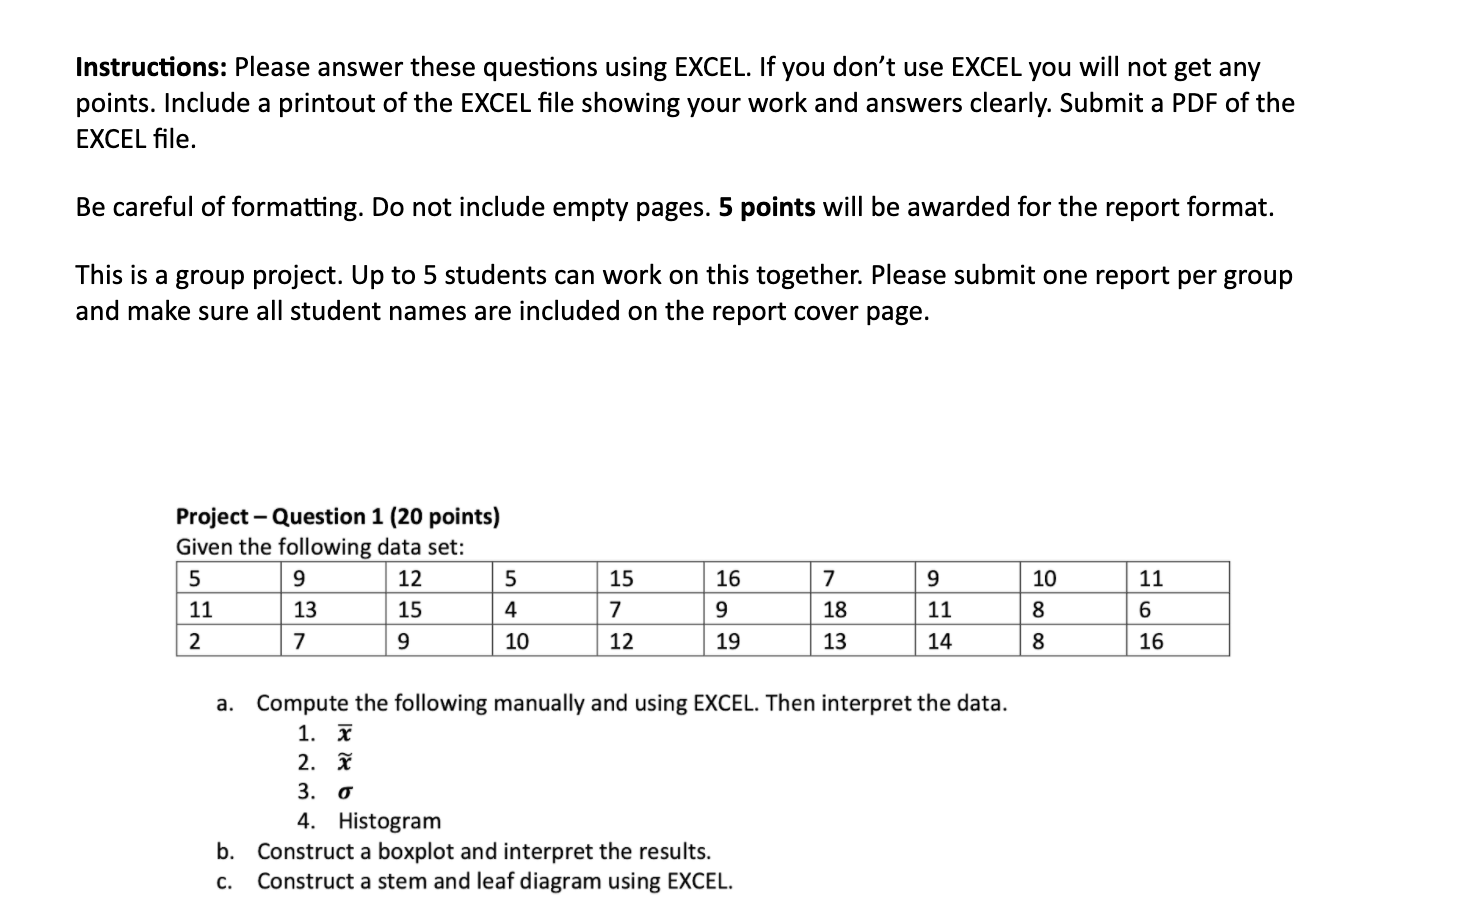
Instructions: Please answer these questions using EXCEL. If you don't use EXCEL you will not get any points. Include a printout of the EXCEL le showing your work and answers clearly. Submit a PDF of the EXCEL le. Be careful of formatting. Do not include empty pages. 5 points will be awarded for the report format. This is a group project. Up to 5 students can work on this together. Please submit one report per group and make sure all student names are included on the report cover page. Project - Question 1 [20 points) Given the following data set: a. Compute the following manually and using EXCEL. Then interpret the data. 1. i 2. 5' 3. a 4. Histogram b. Construct a boxplot and interpret the results. c. Construct a stern and leaf diagram using EXCEL
Step by Step Solution
There are 3 Steps involved in it

Get step-by-step solutions from verified subject matter experts