

Question: This is one question with three parts. CL=Central Line UCL=Upper Control Limit LCL=Lower Control Limit 2 (SPC) - Protected View - Saved to this PC-
This is one question with three parts.
CL=Central Line
UCL=Upper Control Limit
LCL=Lower Control Limit
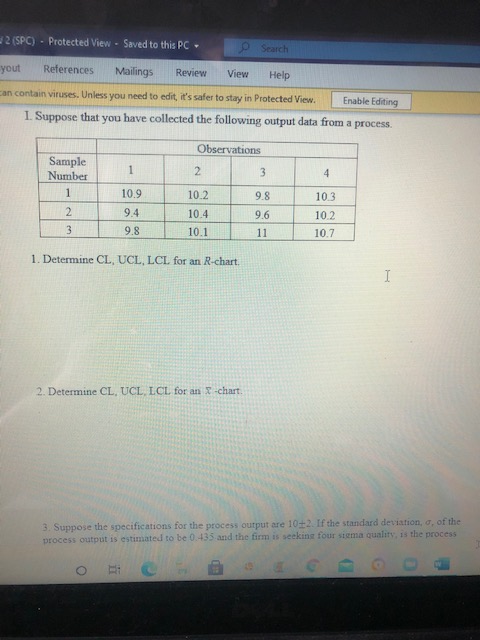
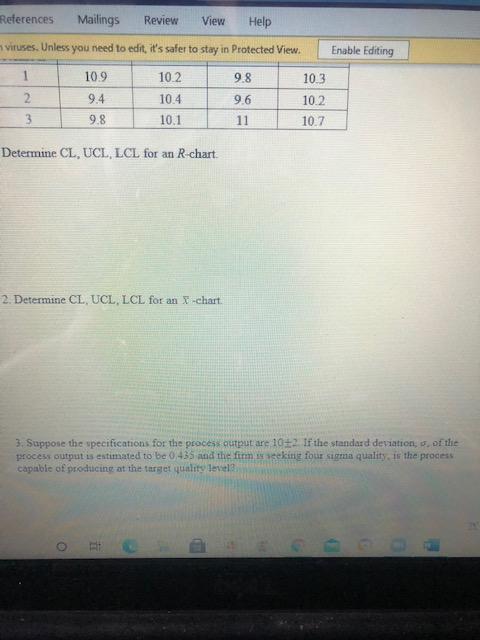
2 (SPC) - Protected View - Saved to this PC- p Search yout References Mailings Review View Help can contain viruses. Unless you need to edit, it's safer to stay in Protected View. Enable Editing 1. Suppose that you have collected the following output data from a process. Observations 1 Sample Number 1 2 3 4 10.9 10.2 9.8 2 9.4 9.8 10.4 10.1 9.6 11 10.3 102 10.7 3 1. Determine CL, UCL, LCL for an R-chart. I 2. Determine CL, UCL LCL for an -chart. 3. Suppose the specifications for the process output are 10:42. If the standard deviation, or of the process output is estimated to be 0.435 and the firm is seeking four sima quality is the process o 1 References Mailings Review View Help viruses. Unless you need to edit, it's safer to stay in Protected View. Enable Editing 1 10.2 9.8 10.3 10.9 9.4 2 9.6 10.4 10.1 102 10.7 3 9.8 11 Determine CL, UCL, LCL for an R-chart. 2. Determine CL, UCL, LCL for an X-chart. 3. Suppose the specifications for the process output are 102. If the standard deviation, o. of the process output is estimated to be 0.435 and the firm is seeking four sigma quality, is the process capable of producing at the target quality level o
Step by Step Solution
There are 3 Steps involved in it
1 Expert Approved Answer
Step: 1 Unlock

Question Has Been Solved by an Expert!
Get step-by-step solutions from verified subject matter experts
Step: 2 Unlock
Step: 3 Unlock