

Question: This is one question with two parts. CL=Central Line UCL=Upper Control Limit LCL=Lower Control Limit W 2 (SPC) (1) Protected View - Saved to this
This is one question with two parts.
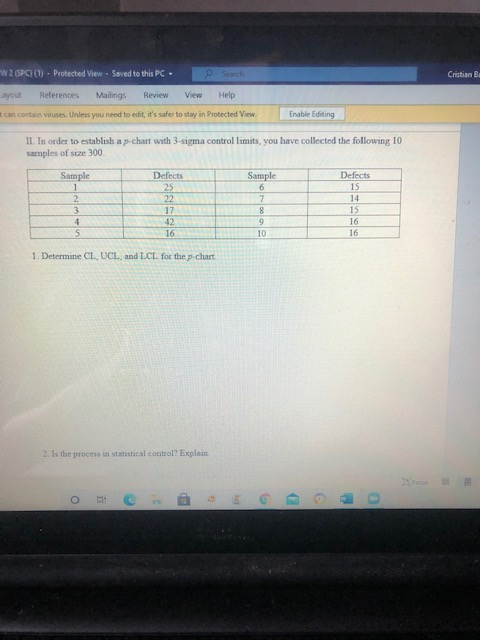
CL=Central Line
UCL=Upper Control Limit
LCL=Lower Control Limit
Step by Step Solution
There are 3 Steps involved in it
1 Expert Approved Answer
Step: 1 Unlock

Question Has Been Solved by an Expert!
Get step-by-step solutions from verified subject matter experts
Step: 2 Unlock
Step: 3 Unlock