

Question: This is one question with two parts. Please label each answer clearly, thank you. CL= Central Line UCL=Upper Control Limit LCL= Lower Control Limit II.
This is one question with two parts. Please label each answer clearly, thank you.
CL= Central Line
UCL=Upper Control Limit
LCL= Lower Control Limit
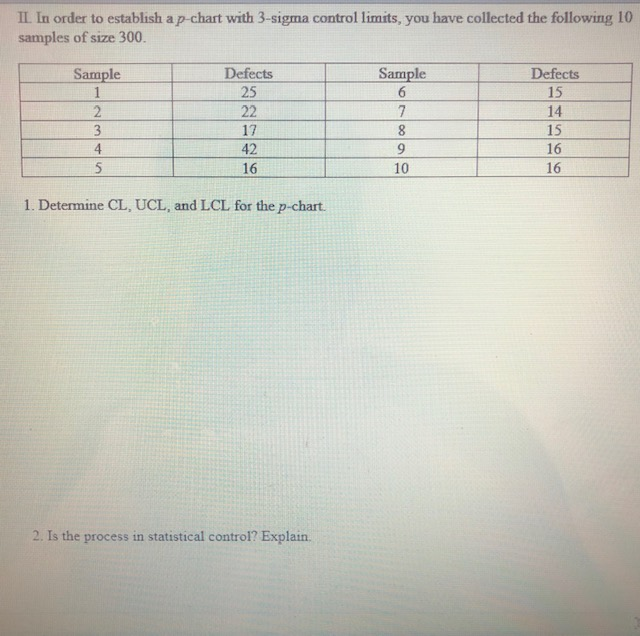
II. In order to establish a pchart with 3-sigma control limits, you have collected the following 10 samples of size 300. Sample 1 2 3 4 5 Defects 25 22 17 42 16 Sample 6 7 8 9 10 Defects 15 14 15 16 16 1. Determine CL, UCL, and LCL for the p-chart. 2. Is the process in statistical control? Explain
Step by Step Solution
There are 3 Steps involved in it
1 Expert Approved Answer
Step: 1 Unlock

Question Has Been Solved by an Expert!
Get step-by-step solutions from verified subject matter experts
Step: 2 Unlock
Step: 3 Unlock