

Question: This is R programing. Someone previously answered it with python. I am not sure what I am doing incorrect because it seems all correct to
This is R programing. Someone previously answered it with python. I am not sure what I am doing incorrect because it seems all correct to me and the dimensions match up to what they are supposed to be. This is what I have so far. 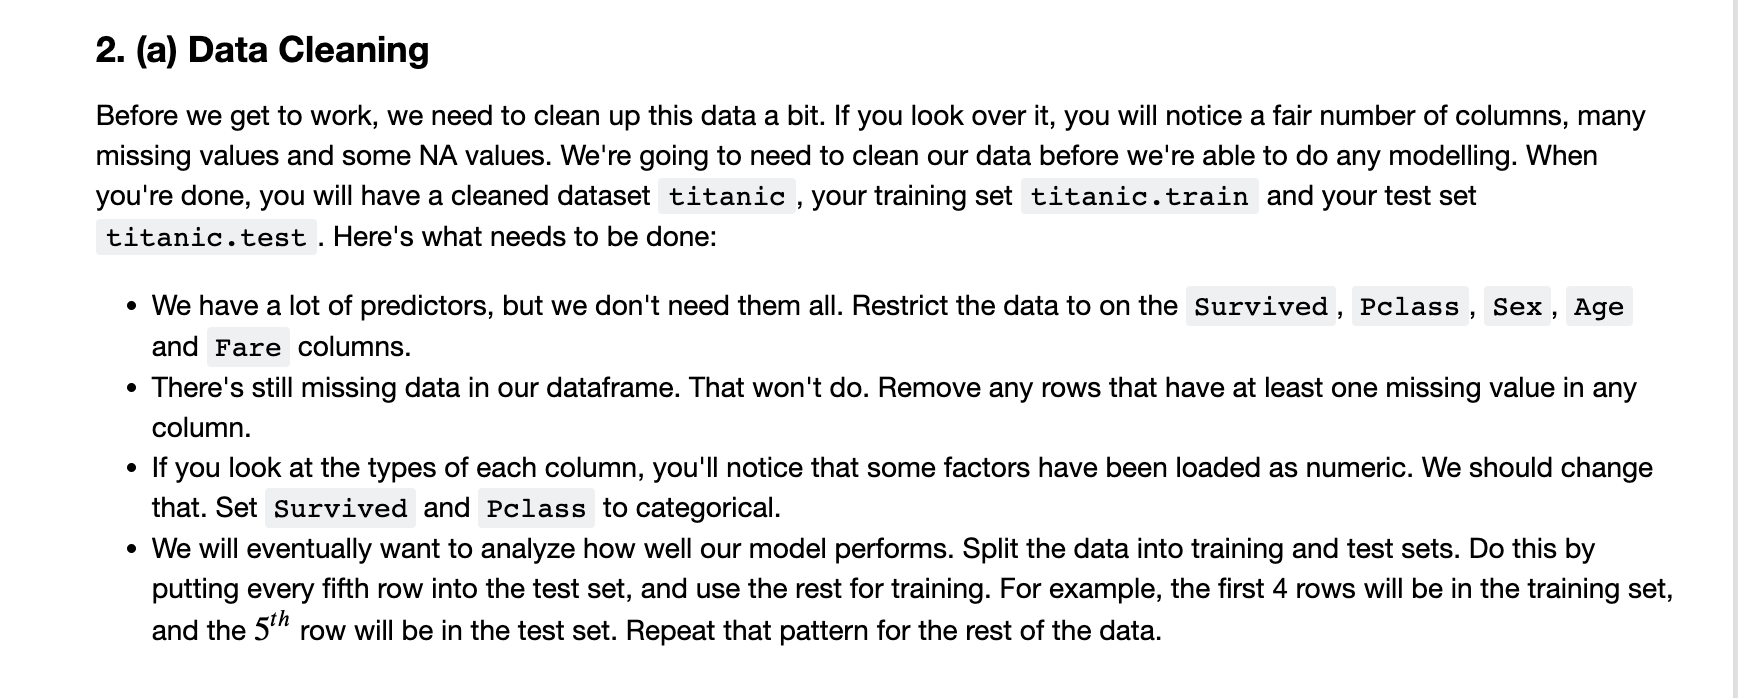
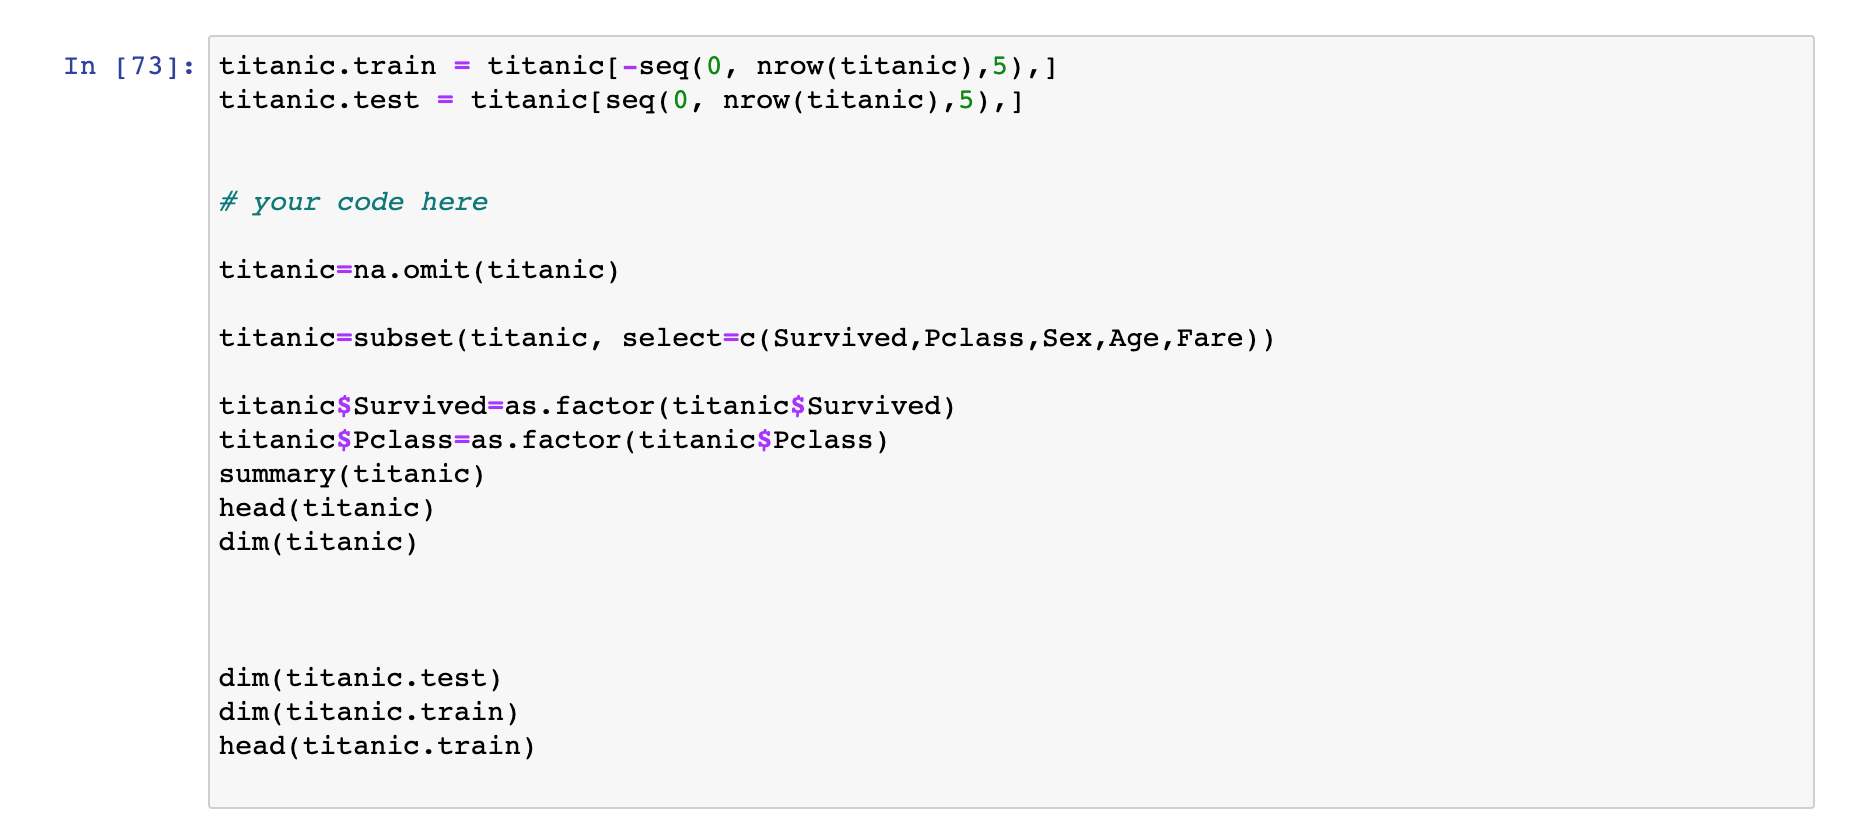
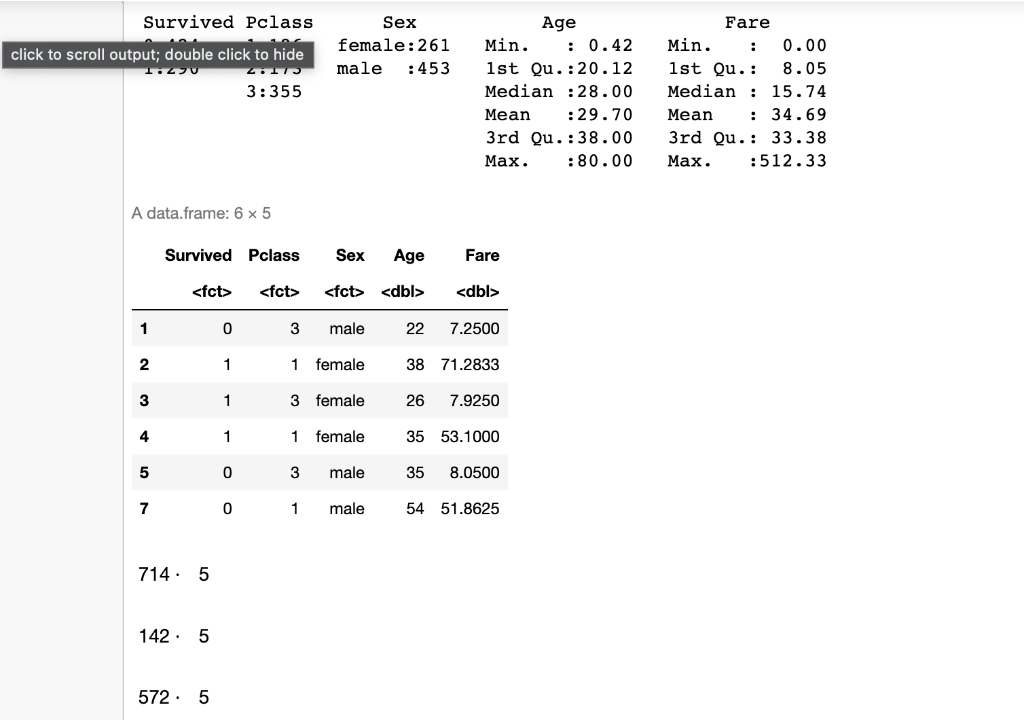
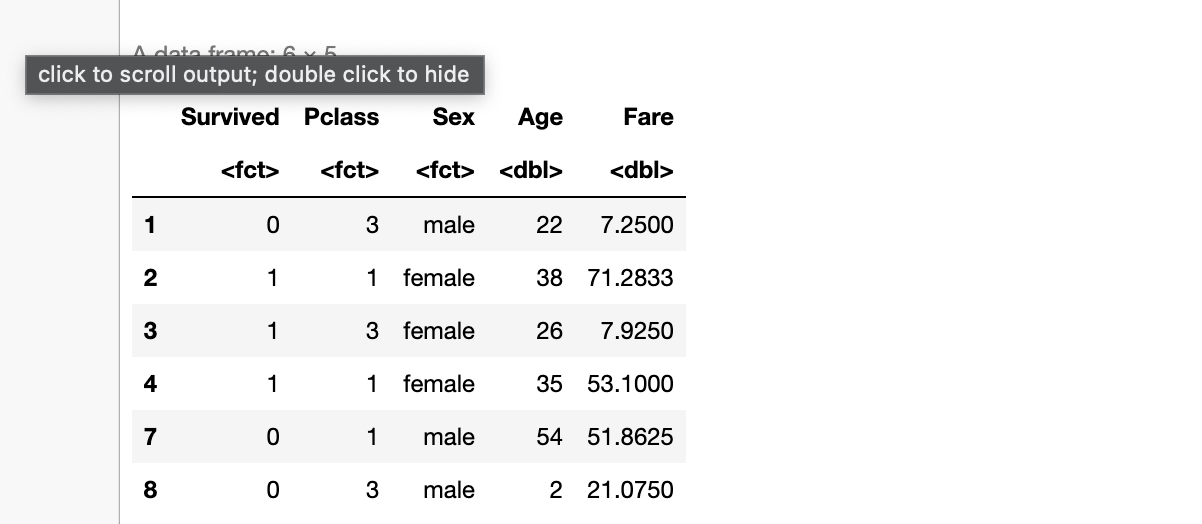
2. (a) Data Cleaning Before we get to work, we need to clean up this data a bit. If you look over it, you will notice a fair number of columns, many missing values and some NA values. We're going to need to clean our data before we're able to do any modelling. When you're done, you will have a cleaned dataset titanic, your training set titanic.train and your test set titanic.test. Here's what needs to be done: - We have a lot of predictors, but we don't need them all. Restrict the data to on the and columns. - There's still missing data in our dataframe. That won't do. Remove any rows that have at least one missing value in any column. - If you look at the types of each column, you'll notice that some factors have been loaded as numeric. We should change that. Set Survived and Pclass to categorical. - We will eventually want to analyze how well our model performs. Split the data into training and test sets. Do this by putting every fifth row into the test set, and use the rest for training. For example, the first 4 rows will be in the training set, and the 5th row will be in the test set. Repeat that pattern for the rest of the data. titanic.train = titanic [seq(0, nrow (titanic),5), titanic.test = titanic [ seq (0, nrow(titanic), 5), ] \# your code here titanic=na.omit(titanic) titanic=subset(titanic, select=c(Survived, Pclass, Sex, Age, Fare)) titanic $ Survived=as.factor(titanic\$Survived) titanic $ Pclass=as.factor(titanic $ Pclass) summary(titanic) head(titanic) dim(titanic) dim(titanic.test) dim(titanic.train) head(titanic.train) A data.frame: 65 click to scroll output; double click to hide \begin{tabular}{rrrrrr} & Survived
Step by Step Solution
There are 3 Steps involved in it

Get step-by-step solutions from verified subject matter experts