

Question: THIS IS THE PROBLEM 2 TABLE 5) Using the table created in Problem #2 above, plot the opportunity set of risky assets in Excel. Then
THIS IS THE PROBLEM 2 TABLE
5) Using the table created in Problem #2 above, plot the opportunity set of risky assets in Excel.
Then vary the correlation between stocks and bonds from + 1 to -1 and describe the changes in shape of the efficient frontier as you do so.
Upload the Excel file that contains the table & graph.
Also include in Excel file a description of the efficient frontier's shape as you vary the correlation. (10 pts)
6) Using the graph of the opportunity set of risky assets created in Problem #5, answer the following:
a) Change the correlation of stocks and bonds back to 0.25 and observe the shape of the efficient frontier.
Starting at the point that corresponds to 100% Bonds & 0% Stocks, describe what happens to portfolio risk and return as you increase the stock allocation and decrease the bond allocation? Why is this happening? (10 pts)
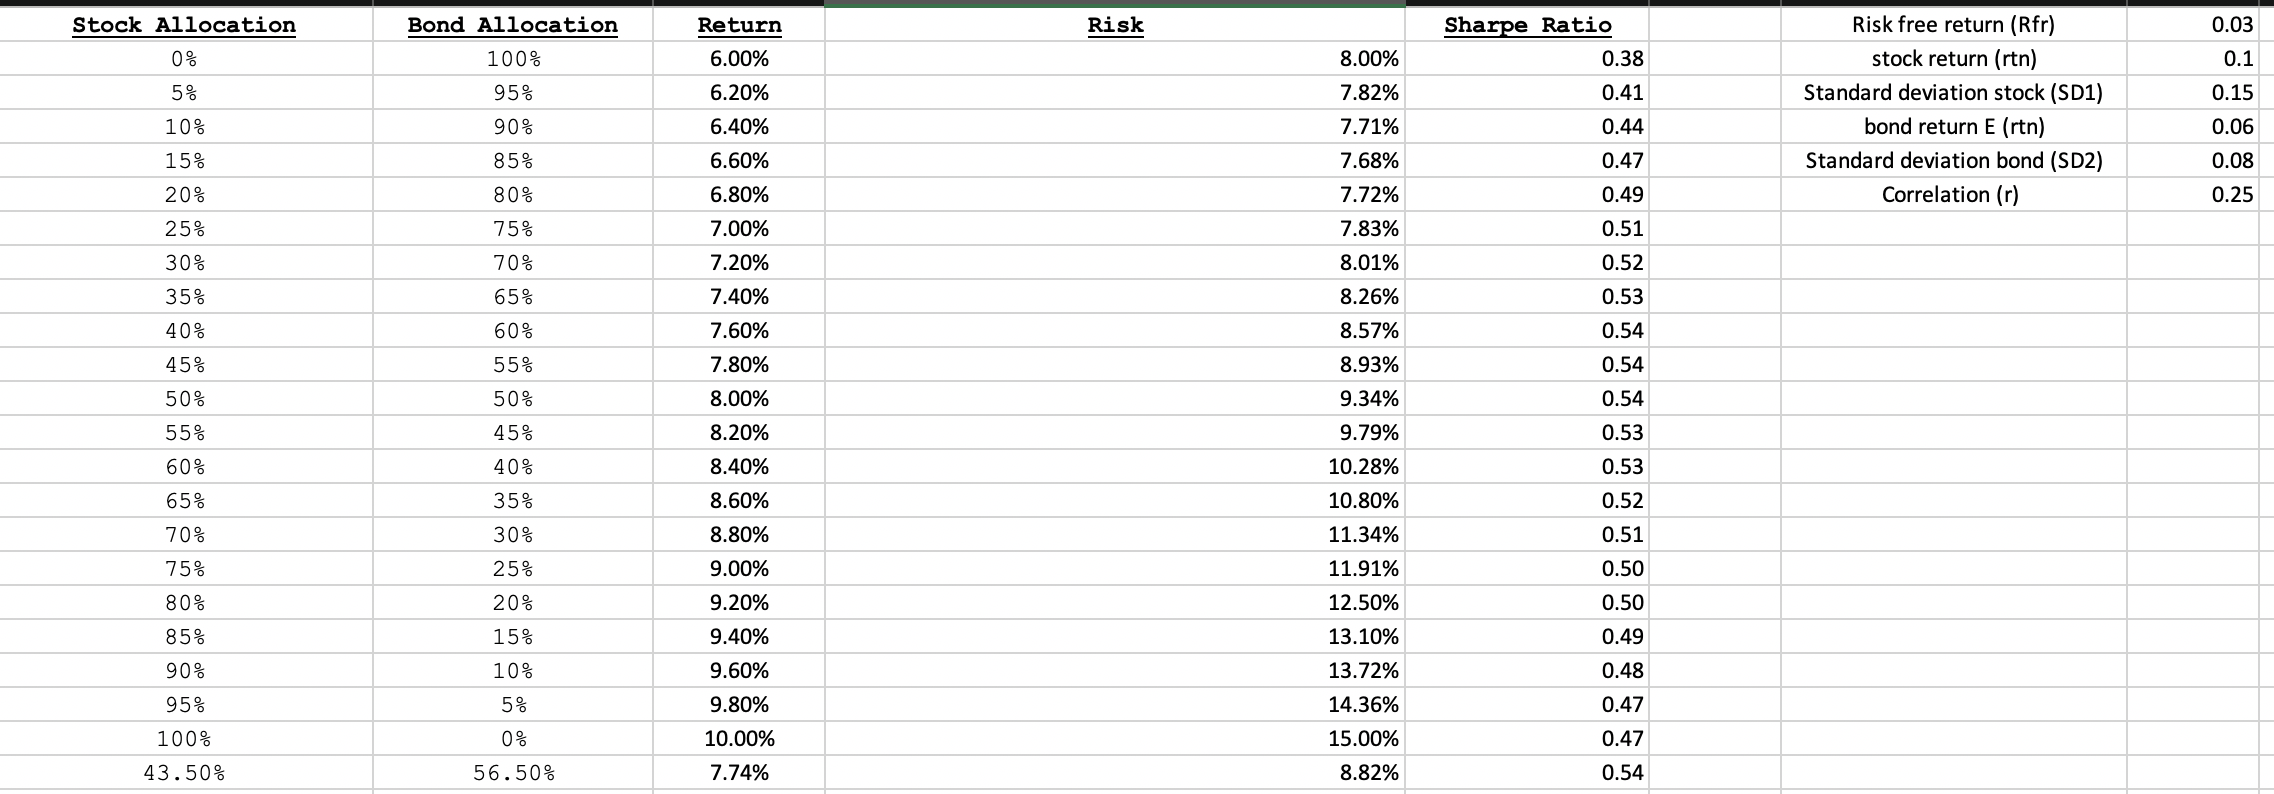
Stock Allocation Risk Sharpe Ratio 0.03 Bond Allocation 100% 0% 8.00% 0.38 0.1 5% 95% 7.82% 0.41 0.15 Return 6.00% 6.20% 6.40% 6.60% 6.80% Risk free return (Rfr) stock return (rtn) Standard deviation stock (SD1) bond return E (rtn) Standard deviation bond (SD2) Correlation (r) 10% 90% 0.44 0.06 0.08 15% 85% 0.47 20% 80% 0.49 0.25 75% 7.00% 0.51 7.71% 7.68% 7.72% 7.83% 8.01% 8.26% 8.57% 8.93% 25% 30% 35% 40% 70% 65% 7.20% 7.40% 7.60% 7.80% 0.52 0.53 0.54 60% 45% 55% 0.54 50% 50% 9.34% 0.54 8.00% 8.20% 45% 0.53 40% 8.40% 0.53 55% 60% 65% 70% 35% 30% 8.60% 8.80% 9.79% 10.28% 10.80% 11.34% 11.91% 0.52 0.51 75% 9.00% 25% 20% 0.50 0.50 80% 85% 15% 9.20% 9.40% 9.60% 12.50% 13.10% 13.72% 0.49 90% 10% 0.48 95% 5% 9.80% 14.36% 0.47 0.47 100% 0% 56.50% 10.00% 7.74% 15.00% 8.82% 43.50% 0.54 Stock Allocation Risk Sharpe Ratio 0.03 Bond Allocation 100% 0% 8.00% 0.38 0.1 5% 95% 7.82% 0.41 0.15 Return 6.00% 6.20% 6.40% 6.60% 6.80% Risk free return (Rfr) stock return (rtn) Standard deviation stock (SD1) bond return E (rtn) Standard deviation bond (SD2) Correlation (r) 10% 90% 0.44 0.06 0.08 15% 85% 0.47 20% 80% 0.49 0.25 75% 7.00% 0.51 7.71% 7.68% 7.72% 7.83% 8.01% 8.26% 8.57% 8.93% 25% 30% 35% 40% 70% 65% 7.20% 7.40% 7.60% 7.80% 0.52 0.53 0.54 60% 45% 55% 0.54 50% 50% 9.34% 0.54 8.00% 8.20% 45% 0.53 40% 8.40% 0.53 55% 60% 65% 70% 35% 30% 8.60% 8.80% 9.79% 10.28% 10.80% 11.34% 11.91% 0.52 0.51 75% 9.00% 25% 20% 0.50 0.50 80% 85% 15% 9.20% 9.40% 9.60% 12.50% 13.10% 13.72% 0.49 90% 10% 0.48 95% 5% 9.80% 14.36% 0.47 0.47 100% 0% 56.50% 10.00% 7.74% 15.00% 8.82% 43.50% 0.54
Step by Step Solution
There are 3 Steps involved in it

Get step-by-step solutions from verified subject matter experts