

Question: This is using jupyter notebook assignment with 2 ccv files added to this file. the csv files have alredy been uploaded prior to the assignment
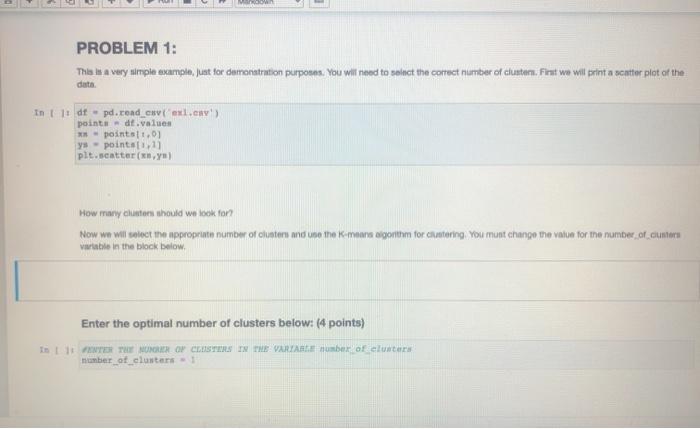
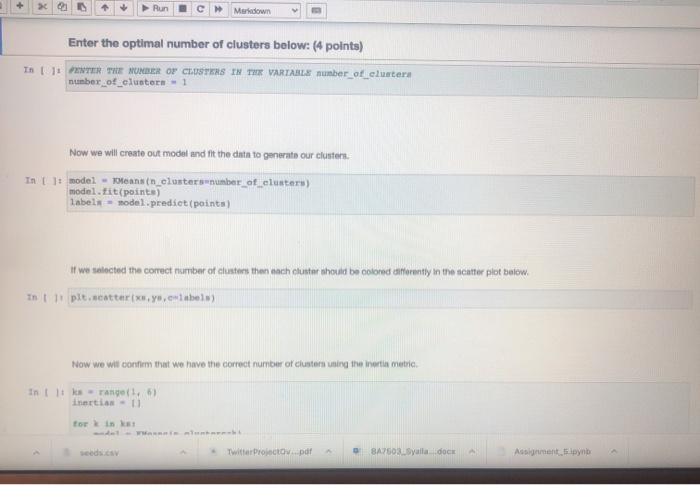
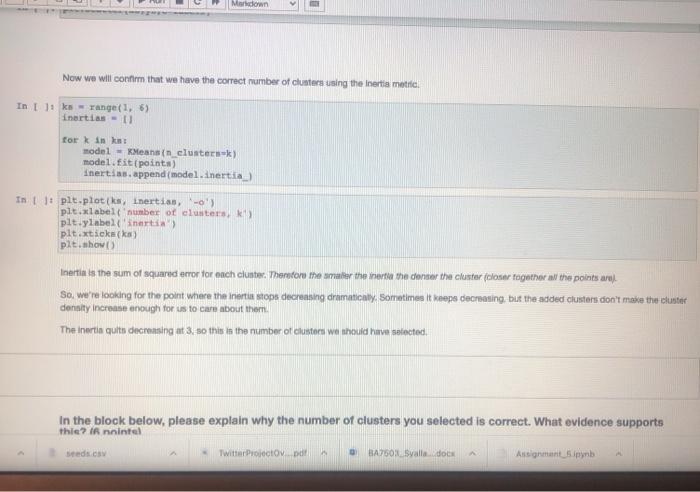

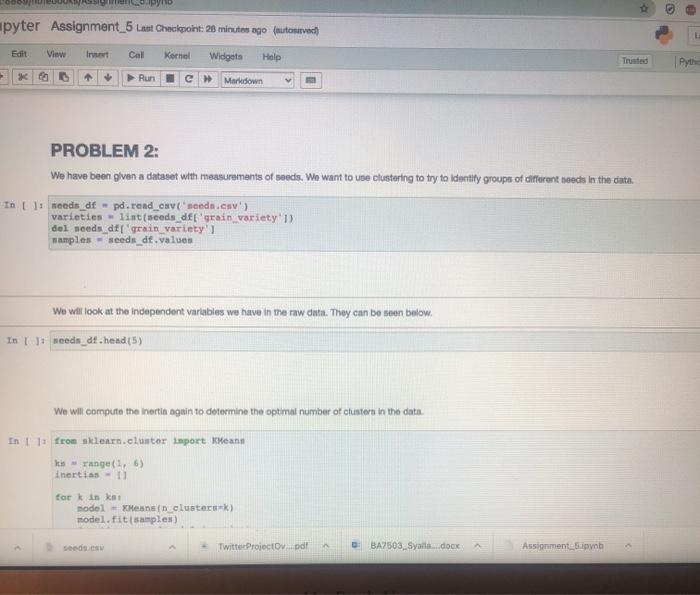
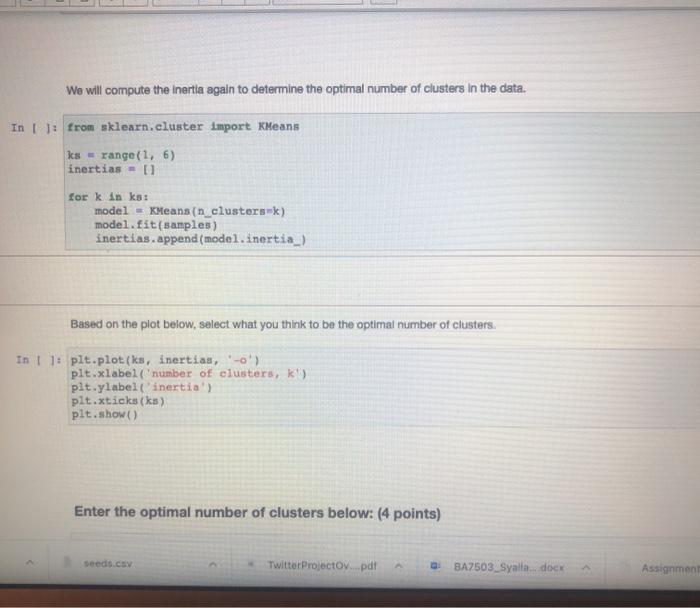
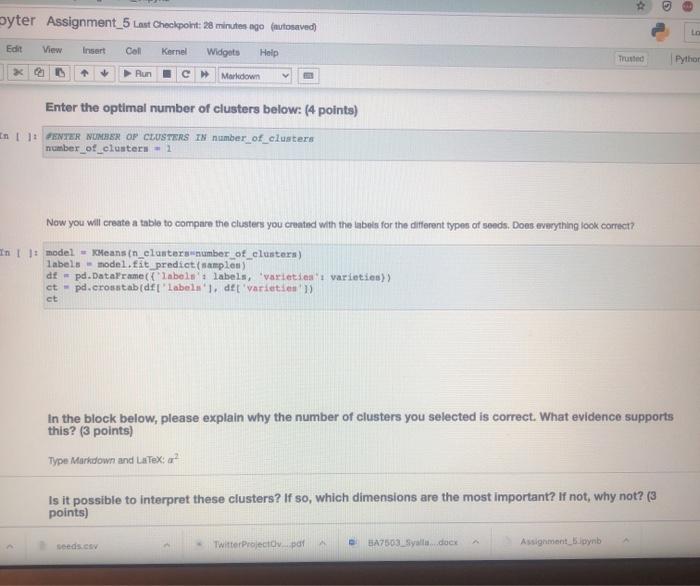
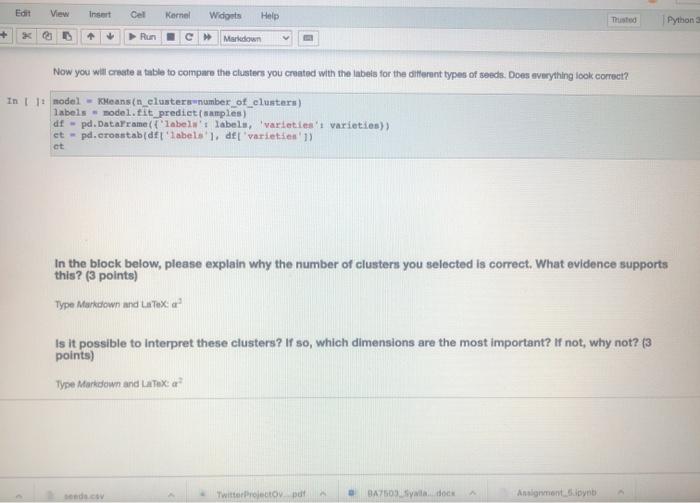
PROBLEM 1: This in a very simple example, just for demonstration purposes. You will need to select the correct number of clustem. Fint we will print a scattor plot of the data In t 11 dtpd.cond_CV (ex.cny's points dt.values - points11.01 ys - points) plt.scatter(x,y) How many clusters should we look for Now we will select the appropriate number of clusters and use the means algorithm for clustering. You must change the value for the number of custos Variable in the block below Enter the optimal number of clusters below: (4 points) In 111 THE NORTH OF CESTERS IN THE VARIABLE mber of cluster number of clusters 1 + X 7 Markdown Enter the optimal number of clusters below: (4 points) In U PETER THE NUMBER OF CASTERS IN THE VARTARLA number_of_clustern number_of_clusters - 1 Now we will create out model and fit the data to generato our clusters. In model - means in clustersunumber_of_clusters) labels - nodel.predict (points) If we selected the correct number of clusters then each cluster should be colored differently in the scatter plot below in pletterielabel Now we will confirm that we have the correct number of clusters using the inerti metria In Its range) inertian torin seeds. Twitter Project pdf BAZS2.Syalla dock Assignment spynb Markdown Now we will confirm that we have the correct number of clusters using the Inertia metifel In 1: ks = range(16) Inertias-11 fork in model = Keans in clusters) model.fit(points) Inertias.append(model. inertia) In plt.plot(ks, inertias, "-0' pit.xlabel number of clusters plt.ylabel('nerti plt.xtieks) ple.shop Inertia in the sum of squared error for each cluster. Therefon the water the inertia e denter the cluster closer together and the points are So, we're looking for the point where the inertia stops decreasing dramaticay. Sometimes it keeps decreasing, but the added clusters don't make the cluster density increase enough for us to care about the The inertis quito decreasing at 3.80 this is the number of cluster we should have selected, In the block below, please explain why the number of clusters you selected is correct. What evidence supports thie? Innintel Twitter Projecto de BA750 Salle does Assignment spynb AM hat notebooksimen pyn jupyter Assignment_5 st Checkport C. In the block below, please explain why the number of clusters you selected is correct. What evidence supports this? (6 points Type Motown and PROBLEM 2: We have been warments of we want to seng to try to group otomata in the date. tert-dewydew Wart_train variety's di dati sampled window BATO MacBook Air BO 2 % 5 8 7 4 9 8 w E R. U Y sle H K pyter Assignment_5 Last Checkpoint: 25 minutes ago (autonvect Widgets Edit View Inert Call Kornel Help 1 Pythe * 0 Run Markdown PROBLEM 2: We have been given a dataset with measurements of needs. We want to use clustering to try to identity groups of different sects in the ciuta. In: needs_df - pd. rend_cavad.csv') varieties - lint (seeds_df['gran variety' 1) del needs_df['grain_variety'l samples - seeds df .values We will look at the independent variables we have in the raw data. They can be seen below. In : weedin_df.head (5) We will compute the inertin again to determine the optimal number of clustern in the data. In 1: from sklearn.cluster inport Keans Is range ( 15) inertias-1 torkin ka model - Mean_clusterk) model.fit samples) edo es Twitter Projectov pdf BA2503 Syala.docx Assignments in We will compute the inertia again to determine the optimal number of clusters in the data. In []: from sklearn.cluster Import KMeans Ks = range(1, 6) inertias - 0 for k in ks: model - KMeans (n_clustersek) model.fit(samples) inertias.append(model. inertia) Based on the plot below, select what you think to be the optimal number of clusters. In 1 ]: pit.plot(ks, inertian, -0' pit.tlabel('number of clusters, k pit.ylabel('inertia') pit.xtieks (ks) plt.show() Enter the optimal number of clusters below: (4 points) seeds.csv Twitter Projectoy...pdf BA7503_Syalla.docx Assignment byter Assignment_5 Last Checkpoint: 28 minutes ago (autosaved) Edit Coll Kernel Widgets Help C Maledown View Insert Pythor Run Enter the optimal number of clusters below: (4 points) In: PENYER NUMBER OF CLUSTERS IN number_of_clusters number_of_clusters - 1 Now you will create a table to compare the clusters you created with the inbets for the different types of sonds, Dons everything look correct? In t model - Keans (n_elantera number_of_clusters) labels model. Eit predict(sample) af - pd.DataFrame({"labels' labels, varieties varieties) ct - pd.crosstab(df['label', det varietsen') ct in the block below, please explain why the number of clusters you selected is correct. What evidence supports this? (3 points) Type Markdown and LaTex: a? Is it possible to interpret these clusters? If so, which dimensions are the most important? If not, why not? (3 points) seeds.csv Twitter Projectdv par BA7503 Syal.docx Assignment_5.pynb Edit View Insert Cel Kernel Widgets Help Trusted Python + Run C Markdown Now you will create a table to compare the clusters you created with the Inbets for the different types of seeds. Does everything look correct? In 1: model - Keans (n_clusters number_of_clusters) labels - model.. tit_prediet (samples) af - pd. DataFrame("labels labels, varieties' varieties) ct - pd.croustabd'labels' l. del varieties']) ct in the block below, please explain why the number of clusters you selected is correct, What evidence supports this? (3 points) Type Markdown and LaTeX: Is it possible to interpret these clusters? If so, which dimensions are the most important? If not, why not? (3 points) Type Markelown and Lax sonda con Twitter Projeto BA7509Sidocx Ansignment.no PROBLEM 1: This in a very simple example, just for demonstration purposes. You will need to select the correct number of clustem. Fint we will print a scattor plot of the data In t 11 dtpd.cond_CV (ex.cny's points dt.values - points11.01 ys - points) plt.scatter(x,y) How many clusters should we look for Now we will select the appropriate number of clusters and use the means algorithm for clustering. You must change the value for the number of custos Variable in the block below Enter the optimal number of clusters below: (4 points) In 111 THE NORTH OF CESTERS IN THE VARIABLE mber of cluster number of clusters 1 + X 7 Markdown Enter the optimal number of clusters below: (4 points) In U PETER THE NUMBER OF CASTERS IN THE VARTARLA number_of_clustern number_of_clusters - 1 Now we will create out model and fit the data to generato our clusters. In model - means in clustersunumber_of_clusters) labels - nodel.predict (points) If we selected the correct number of clusters then each cluster should be colored differently in the scatter plot below in pletterielabel Now we will confirm that we have the correct number of clusters using the inerti metria In Its range) inertian torin seeds. Twitter Project pdf BAZS2.Syalla dock Assignment spynb Markdown Now we will confirm that we have the correct number of clusters using the Inertia metifel In 1: ks = range(16) Inertias-11 fork in model = Keans in clusters) model.fit(points) Inertias.append(model. inertia) In plt.plot(ks, inertias, "-0' pit.xlabel number of clusters plt.ylabel('nerti plt.xtieks) ple.shop Inertia in the sum of squared error for each cluster. Therefon the water the inertia e denter the cluster closer together and the points are So, we're looking for the point where the inertia stops decreasing dramaticay. Sometimes it keeps decreasing, but the added clusters don't make the cluster density increase enough for us to care about the The inertis quito decreasing at 3.80 this is the number of cluster we should have selected, In the block below, please explain why the number of clusters you selected is correct. What evidence supports thie? Innintel Twitter Projecto de BA750 Salle does Assignment spynb AM hat notebooksimen pyn jupyter Assignment_5 st Checkport C. In the block below, please explain why the number of clusters you selected is correct. What evidence supports this? (6 points Type Motown and PROBLEM 2: We have been warments of we want to seng to try to group otomata in the date. tert-dewydew Wart_train variety's di dati sampled window BATO MacBook Air BO 2 % 5 8 7 4 9 8 w E R. U Y sle H K pyter Assignment_5 Last Checkpoint: 25 minutes ago (autonvect Widgets Edit View Inert Call Kornel Help 1 Pythe * 0 Run Markdown PROBLEM 2: We have been given a dataset with measurements of needs. We want to use clustering to try to identity groups of different sects in the ciuta. In: needs_df - pd. rend_cavad.csv') varieties - lint (seeds_df['gran variety' 1) del needs_df['grain_variety'l samples - seeds df .values We will look at the independent variables we have in the raw data. They can be seen below. In : weedin_df.head (5) We will compute the inertin again to determine the optimal number of clustern in the data. In 1: from sklearn.cluster inport Keans Is range ( 15) inertias-1 torkin ka model - Mean_clusterk) model.fit samples) edo es Twitter Projectov pdf BA2503 Syala.docx Assignments in We will compute the inertia again to determine the optimal number of clusters in the data. In []: from sklearn.cluster Import KMeans Ks = range(1, 6) inertias - 0 for k in ks: model - KMeans (n_clustersek) model.fit(samples) inertias.append(model. inertia) Based on the plot below, select what you think to be the optimal number of clusters. In 1 ]: pit.plot(ks, inertian, -0' pit.tlabel('number of clusters, k pit.ylabel('inertia') pit.xtieks (ks) plt.show() Enter the optimal number of clusters below: (4 points) seeds.csv Twitter Projectoy...pdf BA7503_Syalla.docx Assignment byter Assignment_5 Last Checkpoint: 28 minutes ago (autosaved) Edit Coll Kernel Widgets Help C Maledown View Insert Pythor Run Enter the optimal number of clusters below: (4 points) In: PENYER NUMBER OF CLUSTERS IN number_of_clusters number_of_clusters - 1 Now you will create a table to compare the clusters you created with the inbets for the different types of sonds, Dons everything look correct? In t model - Keans (n_elantera number_of_clusters) labels model. Eit predict(sample) af - pd.DataFrame({"labels' labels, varieties varieties) ct - pd.crosstab(df['label', det varietsen') ct in the block below, please explain why the number of clusters you selected is correct. What evidence supports this? (3 points) Type Markdown and LaTex: a? Is it possible to interpret these clusters? If so, which dimensions are the most important? If not, why not? (3 points) seeds.csv Twitter Projectdv par BA7503 Syal.docx Assignment_5.pynb Edit View Insert Cel Kernel Widgets Help Trusted Python + Run C Markdown Now you will create a table to compare the clusters you created with the Inbets for the different types of seeds. Does everything look correct? In 1: model - Keans (n_clusters number_of_clusters) labels - model.. tit_prediet (samples) af - pd. DataFrame("labels labels, varieties' varieties) ct - pd.croustabd'labels' l. del varieties']) ct in the block below, please explain why the number of clusters you selected is correct, What evidence supports this? (3 points) Type Markdown and LaTeX: Is it possible to interpret these clusters? If so, which dimensions are the most important? If not, why not? (3 points) Type Markelown and Lax sonda con Twitter Projeto BA7509Sidocx Ansignment.no
Step by Step Solution
There are 3 Steps involved in it

Get step-by-step solutions from verified subject matter experts