

Question: This output is based on a study examining whether the amount of fun one has can be predicted by the number of parties one attends

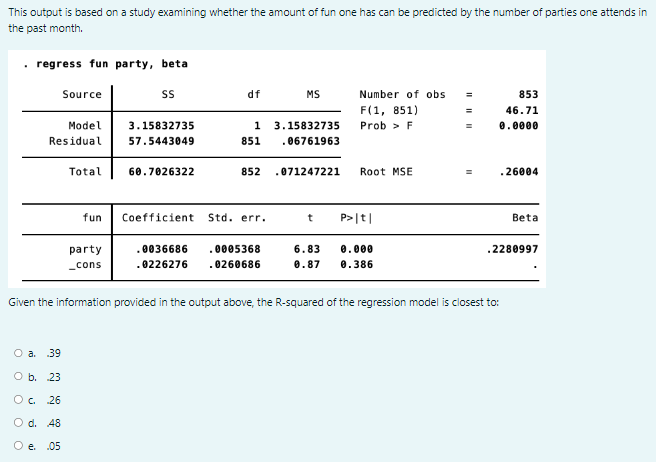
This output is based on a study examining whether the amount of fun one has can be predicted by the number of parties one attends in the past month. . regress fun party, beta Source SS df MS Number of obs 853 F (1, 851) 46.71 Model 3. 15832735 1 3.15832735 Prob > F 0. 0080 Residual 57.5443049 851 . 06761963 Total 60 . 7026322 852 . 071247221 Root MSE . 26004 fun Coefficient Sto. err. t P> /t| Beta party . 0036686 . 0805368 6.83 0.000 . 2280997 Cons . 0226276 . 0260686 0.87 0.386 Given the information provided in the output above, the R-squared of the regression model is closest to: O a. .39 O b. 23 O C .26 O d. 48 De. .05
Step by Step Solution
There are 3 Steps involved in it

Get step-by-step solutions from verified subject matter experts