

Question: This paper aims to test the module ILOs using a practical real-life case-study. In this case study, you are going to play the role of
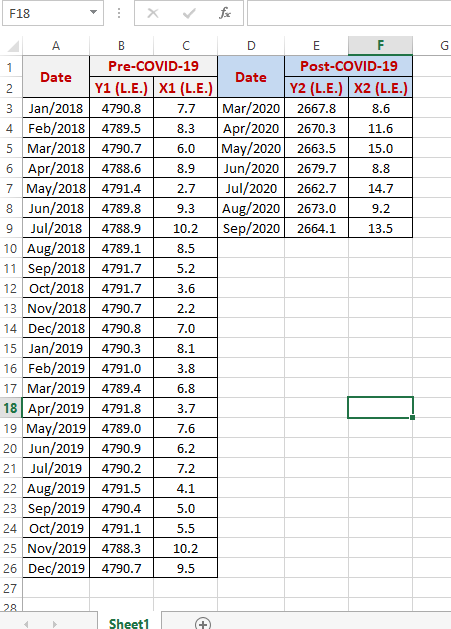
This paper aims to test the module ILOs using a practical real-life case-study. In this case study, you are going to play the role of an analyst for one of the corporates, let us call it Company-Z. Therefore, let us first introduce the case-study random variables: Y1 is the Company-Z monthly revenue along the period Pre-COVID-19 (January 2018 to December 2019); Y2 is the same Company-Z monthly revenue but during the period Post-COVID-19 (March 2020 to September 2020); X1 is the monthly operations cost during the period Pre-COVID-19 (January 2018 to December 2019); while X2 is the same monthly operations cost but during the period Post-COVID-19 (March 2020 to September 2020). Accordingly, in your analysis, you will depend on two main random variables over two time series. The first random variable is the Company-Z monthly revenue Y, and the second random variable is the Company-Z monthly operations cost X. The two random variables were chosen over two periods of time: the first is (Pre-COVID-19: January 2018 to December 2019), and the second is (Post-COVID-19: March 2020 to September 2020). Your task is to prepare a comprehensive report to the company, fulfilling specific requirements outlined below in point (3).
- What are the appropriate descriptive statistics to summarize the Company-Z monthly revenue in Pre- and Post- COVID-19 Y1 & Y2? Can you visualize both random variables separately using the appropriate graphing technique?
- What are the 95 percent confidence intervals for the average monthly operations cost Pre- and Post- COVID-19 X1& X2? And what do you conclude by comparing these intervals? Moreover, what is the used methodology of constructing the confidence interval for each random variable, and why did you use the proposed methodology for each random variable?
- Suppose there is a hypothesis arguing that the population mean of the monthly operations cost is 0.9 times the value of the average monthly operations cost during the period Pre-COVID-19 X1, and 1.3 times the value of the average monthly operations cost during the period Post-COVID-19 X2. Write the full analytical steps to test the two proposed hypotheses? And comment on the results?
- What is the appropriate technique to analyse the power of the relationship between the monthly revenue Pre-COVID-19 Y1 and the monthly operations cost Pre-COVID-19 X1? Write the full analytical steps? And comment on the results?
- What is the appropriate technique to estimate the contribution of the monthly operations cost Pre-COVID-19 X1 to interpret the variations in the monthly revenue Pre-COVID-19 Y1? What do we call these two random variables in this technique? Write the full analytical steps? And comment on the results?
 The subject is Quantitative Methods (Business)
F18 fo G A B D E 1 Pre-COVID-19 Post-COVID-19 Date Date 2 Y1 (L.E.) X1 (L.E.) Y2 (L.E.) X2 (L.E.) 3 Jan/2018 4790.8 7.7 Mar/2020 2667.8 8.6 4 Feb/2018 4789.5 8.3 Apr/2020 2670.3 11.6 5 Mar/2018 4790.7 6.0 May/2020 2663.5 15.0 6 Apr/2018 4788.6 8.9 Jun/2020 2679.7 8.8 7 May/2018 4791.4 2.7 Jul/2020 2662.7 14.7 8 Jun/2018 4789.8 9.3 Aug/2020 2673.0 9.2 9 Jul/2018 4788.9 10.2 Sep/2020 2664.1 13.5 10 Aug/2018 4789.1 8.5 11 Sep/2018 4791.7 5.2 12 Oct/2018 4791.7 3.6 13 Nov/2018 4790.7 2.2 14 Dec/2018 4790.8 7.0 15 Jan/2019 4790.3 8.1 16 Feb/2019 4791.0 3.8 17 Mar/2019 4789.4 6.8 18 Apr/2019 4791.8 3.7 19 May/2019 4789.0 7.6 20 Jun/2019 4790.9 6.2 21 Jul/2019 4790.2 7.2 22 Aug/2019 4791.5 4.1 23 Sep/2019 4790.4 5.0 24 Oct/2019 4791.1 5.5 25 Nov/2019 4788.3 10.2 26 Dec/2019 4790.7 9.5 27 28 Sheet1 + F18 fo G A B D E 1 Pre-COVID-19 Post-COVID-19 Date Date 2 Y1 (L.E.) X1 (L.E.) Y2 (L.E.) X2 (L.E.) 3 Jan/2018 4790.8 7.7 Mar/2020 2667.8 8.6 4 Feb/2018 4789.5 8.3 Apr/2020 2670.3 11.6 5 Mar/2018 4790.7 6.0 May/2020 2663.5 15.0 6 Apr/2018 4788.6 8.9 Jun/2020 2679.7 8.8 7 May/2018 4791.4 2.7 Jul/2020 2662.7 14.7 8 Jun/2018 4789.8 9.3 Aug/2020 2673.0 9.2 9 Jul/2018 4788.9 10.2 Sep/2020 2664.1 13.5 10 Aug/2018 4789.1 8.5 11 Sep/2018 4791.7 5.2 12 Oct/2018 4791.7 3.6 13 Nov/2018 4790.7 2.2 14 Dec/2018 4790.8 7.0 15 Jan/2019 4790.3 8.1 16 Feb/2019 4791.0 3.8 17 Mar/2019 4789.4 6.8 18 Apr/2019 4791.8 3.7 19 May/2019 4789.0 7.6 20 Jun/2019 4790.9 6.2 21 Jul/2019 4790.2 7.2 22 Aug/2019 4791.5 4.1 23 Sep/2019 4790.4 5.0 24 Oct/2019 4791.1 5.5 25 Nov/2019 4788.3 10.2 26 Dec/2019 4790.7 9.5 27 28 Sheet1 +
Step by Step Solution
There are 3 Steps involved in it

Get step-by-step solutions from verified subject matter experts