

Question: this problem is also asking to develop the estimated regression equation by computing the values of b0 and b1 and also predictijg the percentage of
this problem is also asking to develop the estimated regression equation by computing the values of b0 and b1 and also predictijg the percentage of management jobs held by women in a company that has 60% women employees. 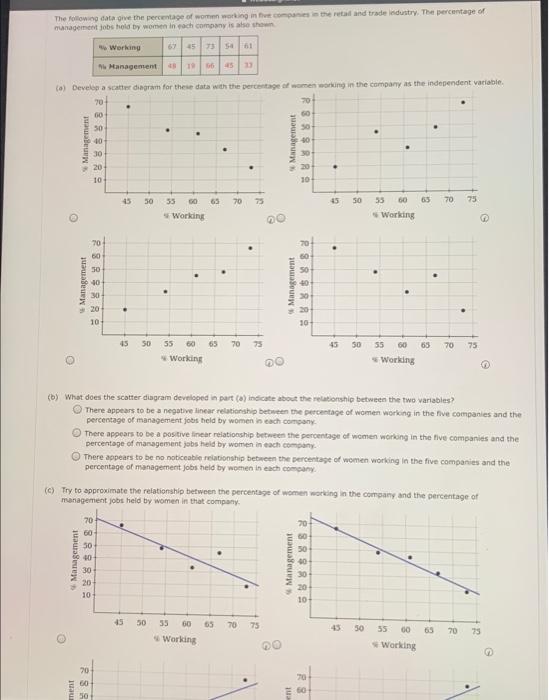
The following data give the percentage of women working in to come the read and trade Industry. The percentage of management jobs told by women in each company is also shown Working 674573561 nu Management 13 (a) Develop a scatte diagram for these data with the percentage of women woning in the company as the independent variable 70 70 00 60 30 30 40 40 10 30 20 - 20 10 10 Management Management . 15 50 35 60 65 70 3 35 50 65 70 75 55 60 Working e Working D 70 70 50 Management 88888 50 40 40 Management . . 330 20 20 . 10 30 45 50 75 50 55 60 65 70 75 55 60 65 70 Working Working (b) What does the scatter diagram developed in part (a) indicate about the relationship between the two variables There appears to be a negative linear relationship between the percentage of women working in the live companies and the percentage of management jos held by women in each company There appears to be a positive linear relationship between the percentage of women working in the five companies and the percentage of management jobs held by women in each company There appears to be no noticeable relationship between the percentage of women working in the five companies and the percentage of management jobs held by women in each company (c) Try to approximate the relationship between the percentage of women working in the company and the percentage of management jobs held by women in that company 20 Management 70 60 50 0 30 20 10 mmmmmm Management $$$88 45 50 65 170 75 45 55 60 Working 50 & 70 75 55 00 Working ment 70 60 50 RS The following data give the percentage of women working in to come the read and trade Industry. The percentage of management jobs told by women in each company is also shown Working 674573561 nu Management 13 (a) Develop a scatte diagram for these data with the percentage of women woning in the company as the independent variable 70 70 00 60 30 30 40 40 10 30 20 - 20 10 10 Management Management . 15 50 35 60 65 70 3 35 50 65 70 75 55 60 Working e Working D 70 70 50 Management 88888 50 40 40 Management . . 330 20 20 . 10 30 45 50 75 50 55 60 65 70 75 55 60 65 70 Working Working (b) What does the scatter diagram developed in part (a) indicate about the relationship between the two variables There appears to be a negative linear relationship between the percentage of women working in the live companies and the percentage of management jos held by women in each company There appears to be a positive linear relationship between the percentage of women working in the five companies and the percentage of management jobs held by women in each company There appears to be no noticeable relationship between the percentage of women working in the five companies and the percentage of management jobs held by women in each company (c) Try to approximate the relationship between the percentage of women working in the company and the percentage of management jobs held by women in that company 20 Management 70 60 50 0 30 20 10 mmmmmm Management $$$88 45 50 65 170 75 45 55 60 Working 50 & 70 75 55 00 Working ment 70 60 50 RS Step by Step Solution
There are 3 Steps involved in it
1 Expert Approved Answer
Step: 1 Unlock

Question Has Been Solved by an Expert!
Get step-by-step solutions from verified subject matter experts
Step: 2 Unlock
Step: 3 Unlock