

Question: q v webassign.net C (b) What does the scatter diagram developed in part (a) indicate about the relationship between the two variables? There appears to
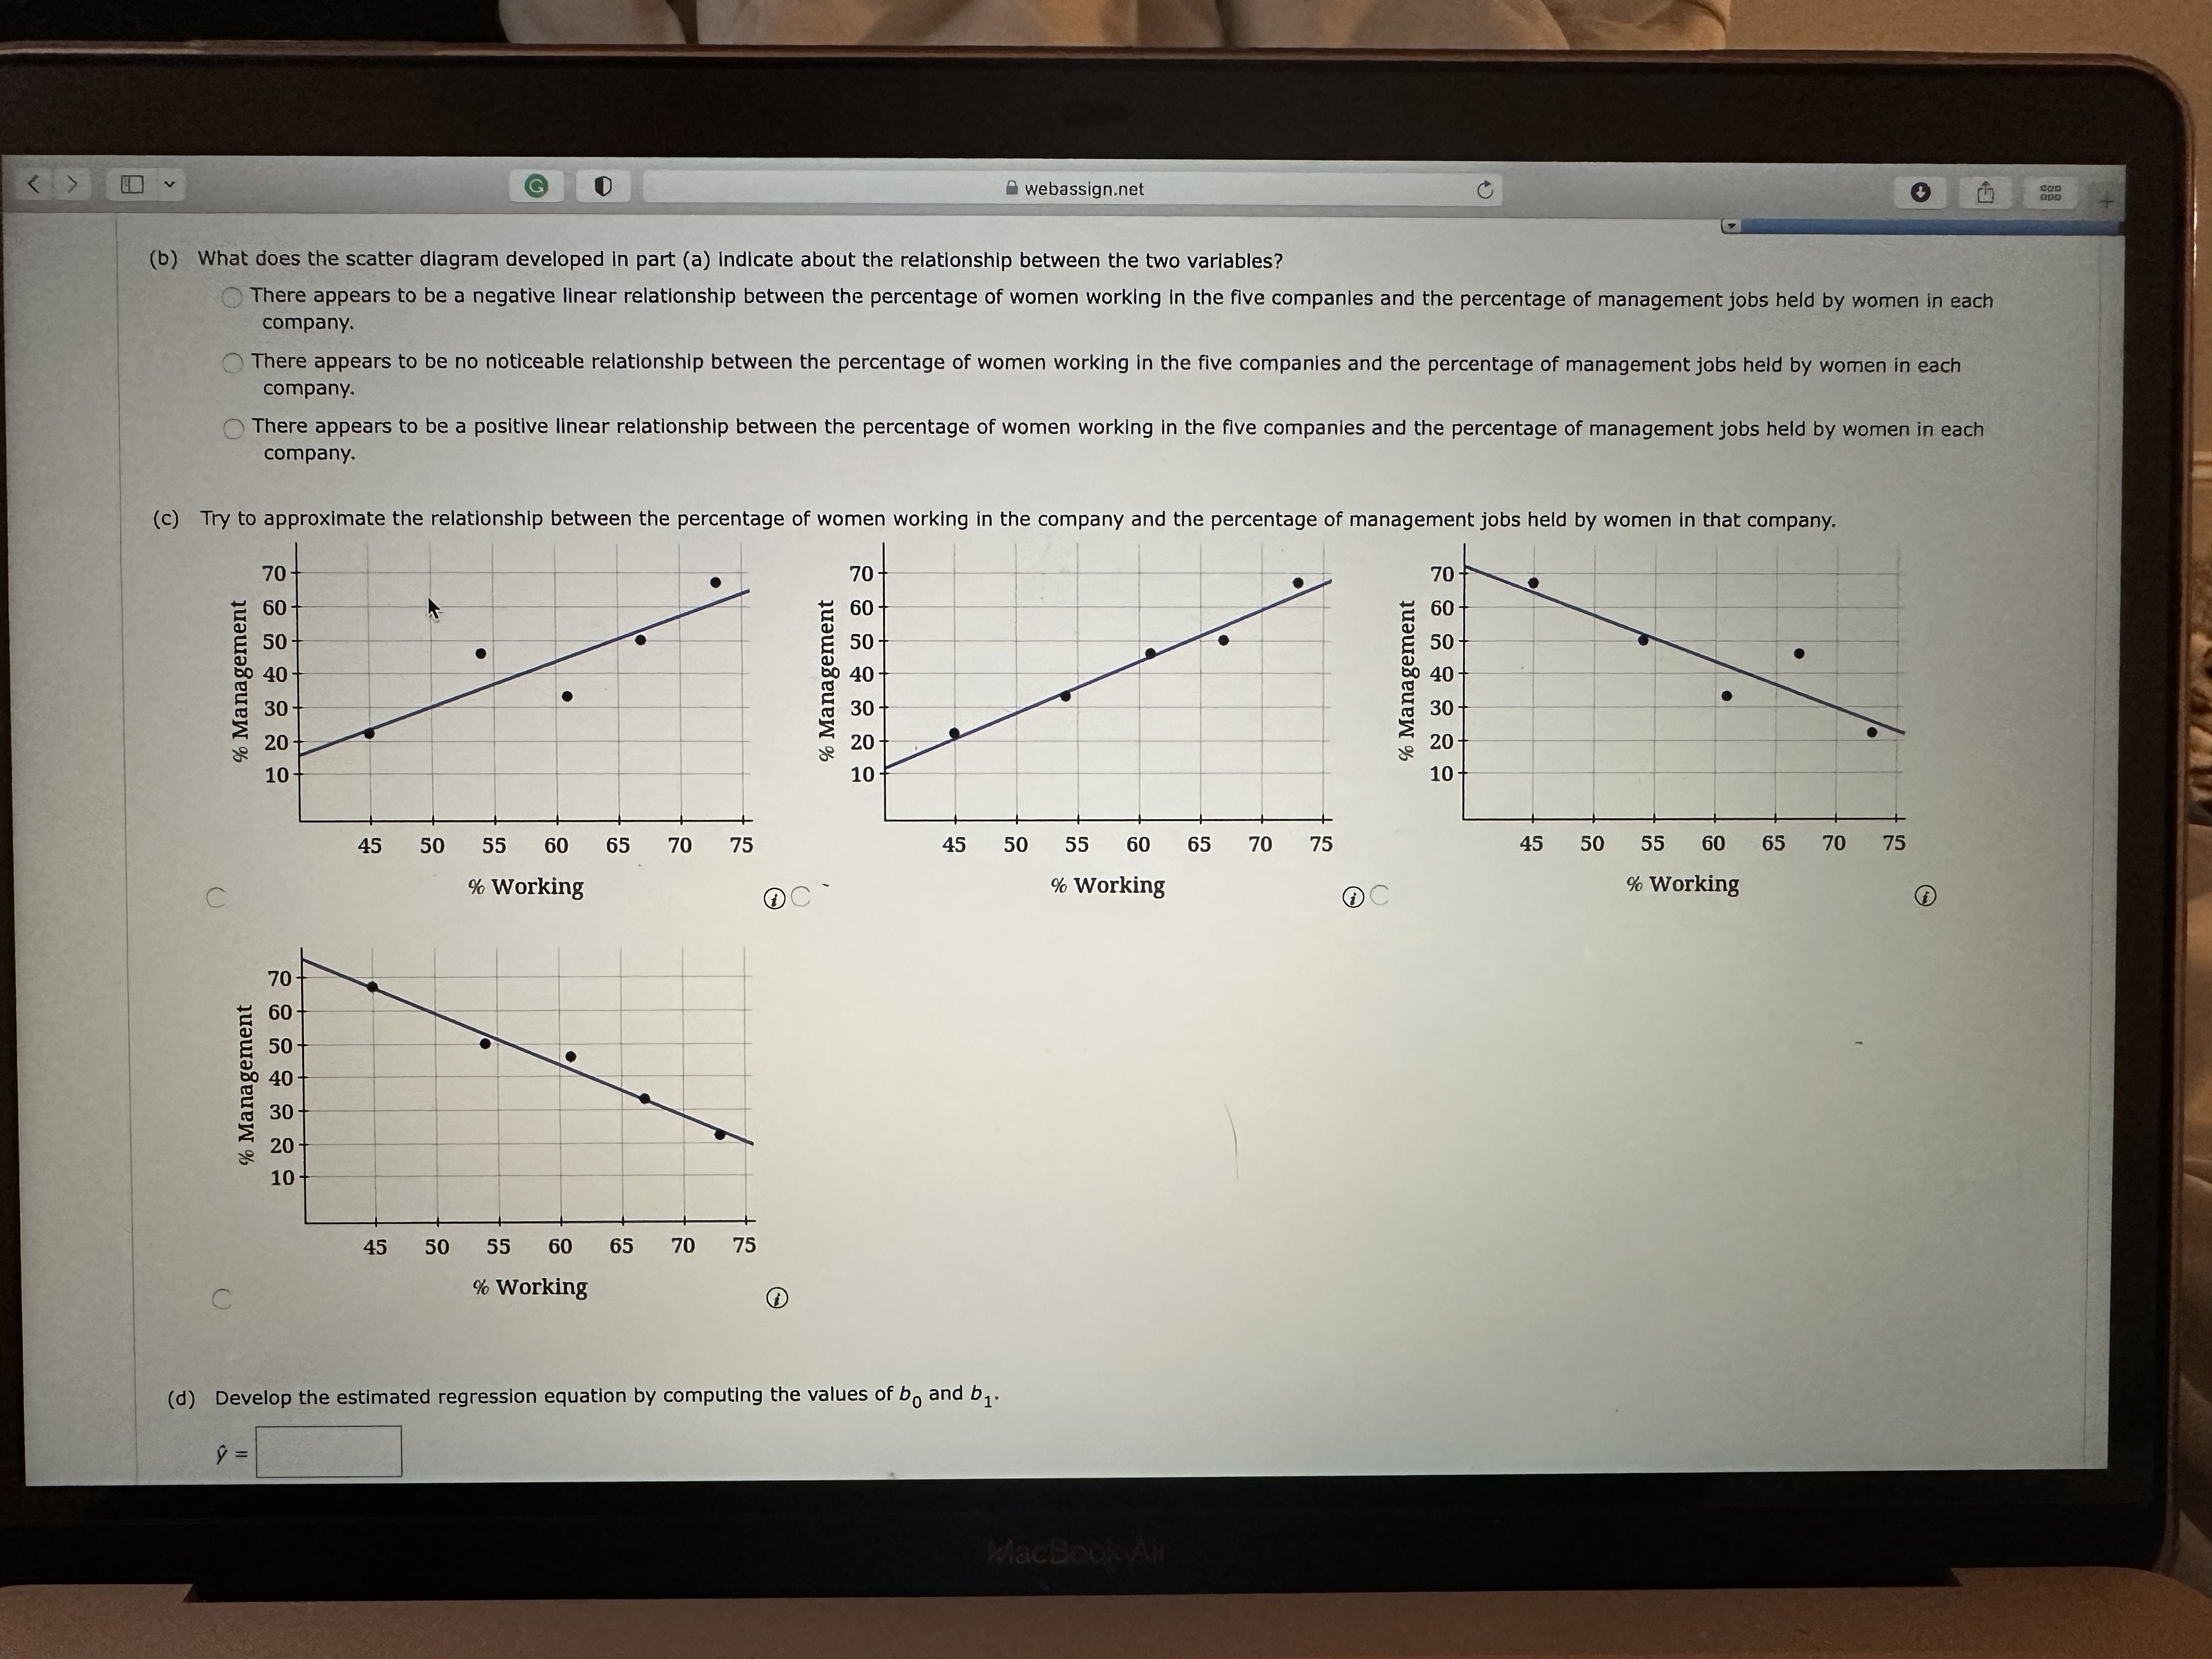
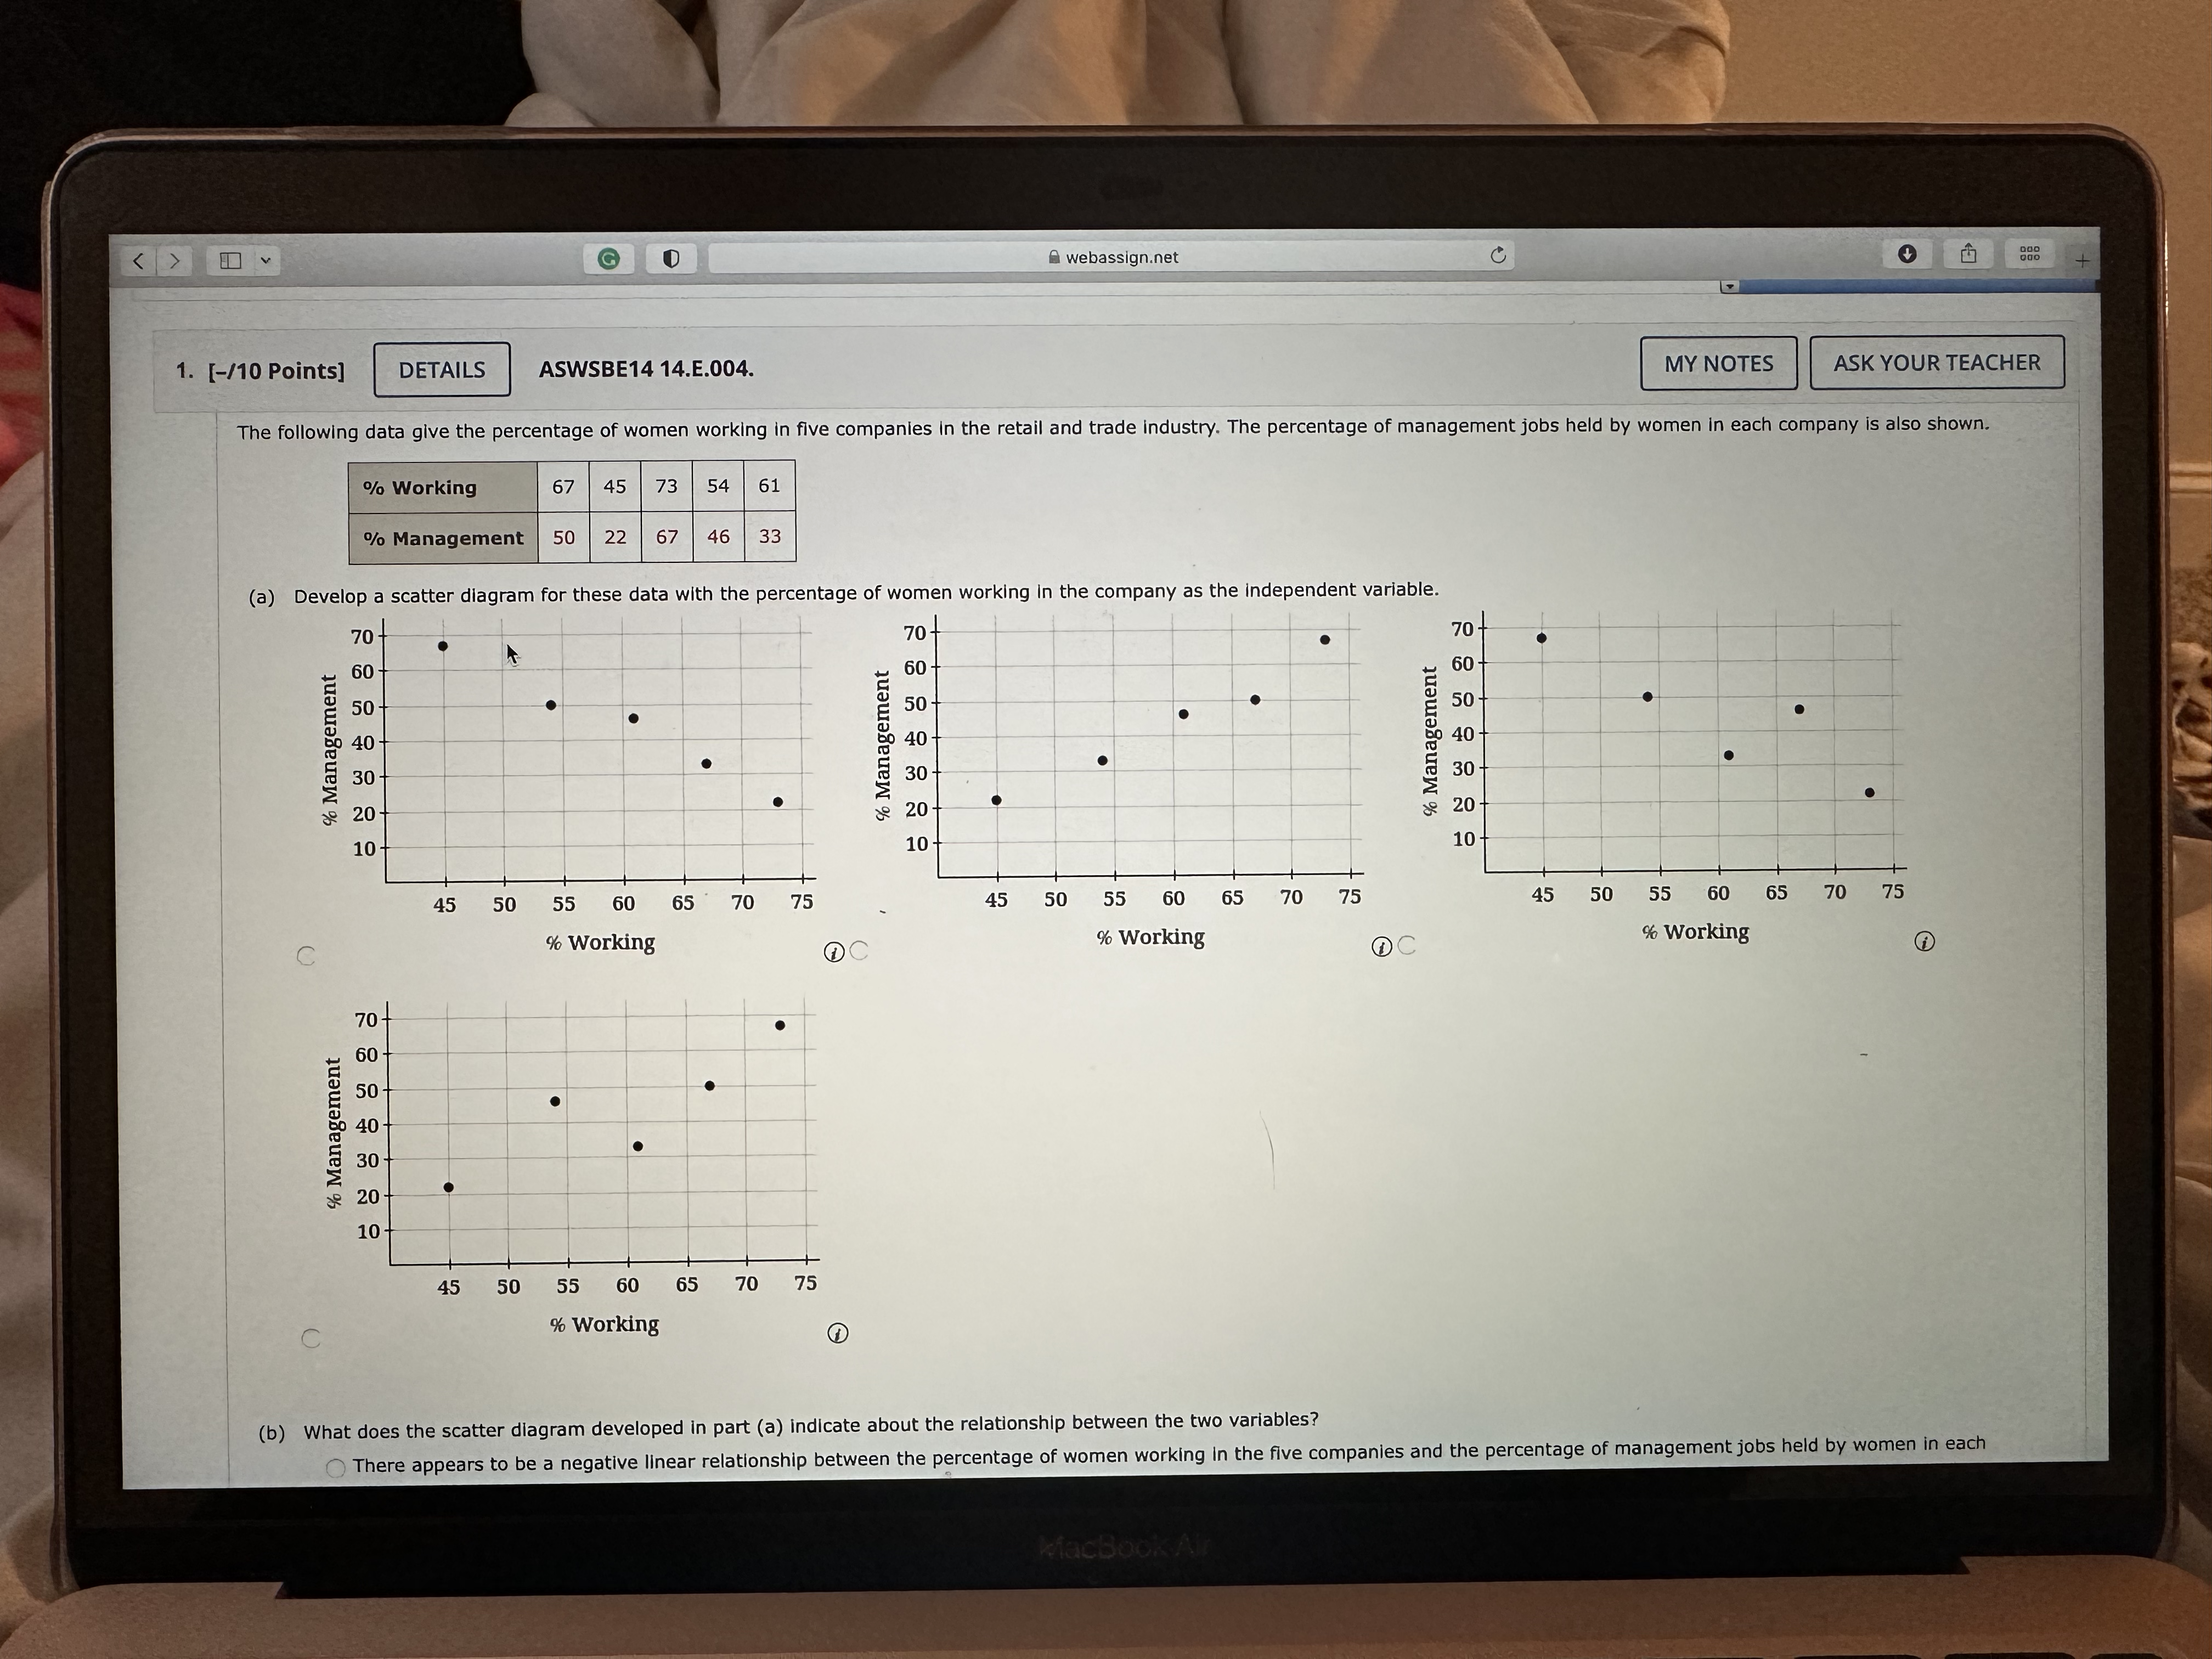
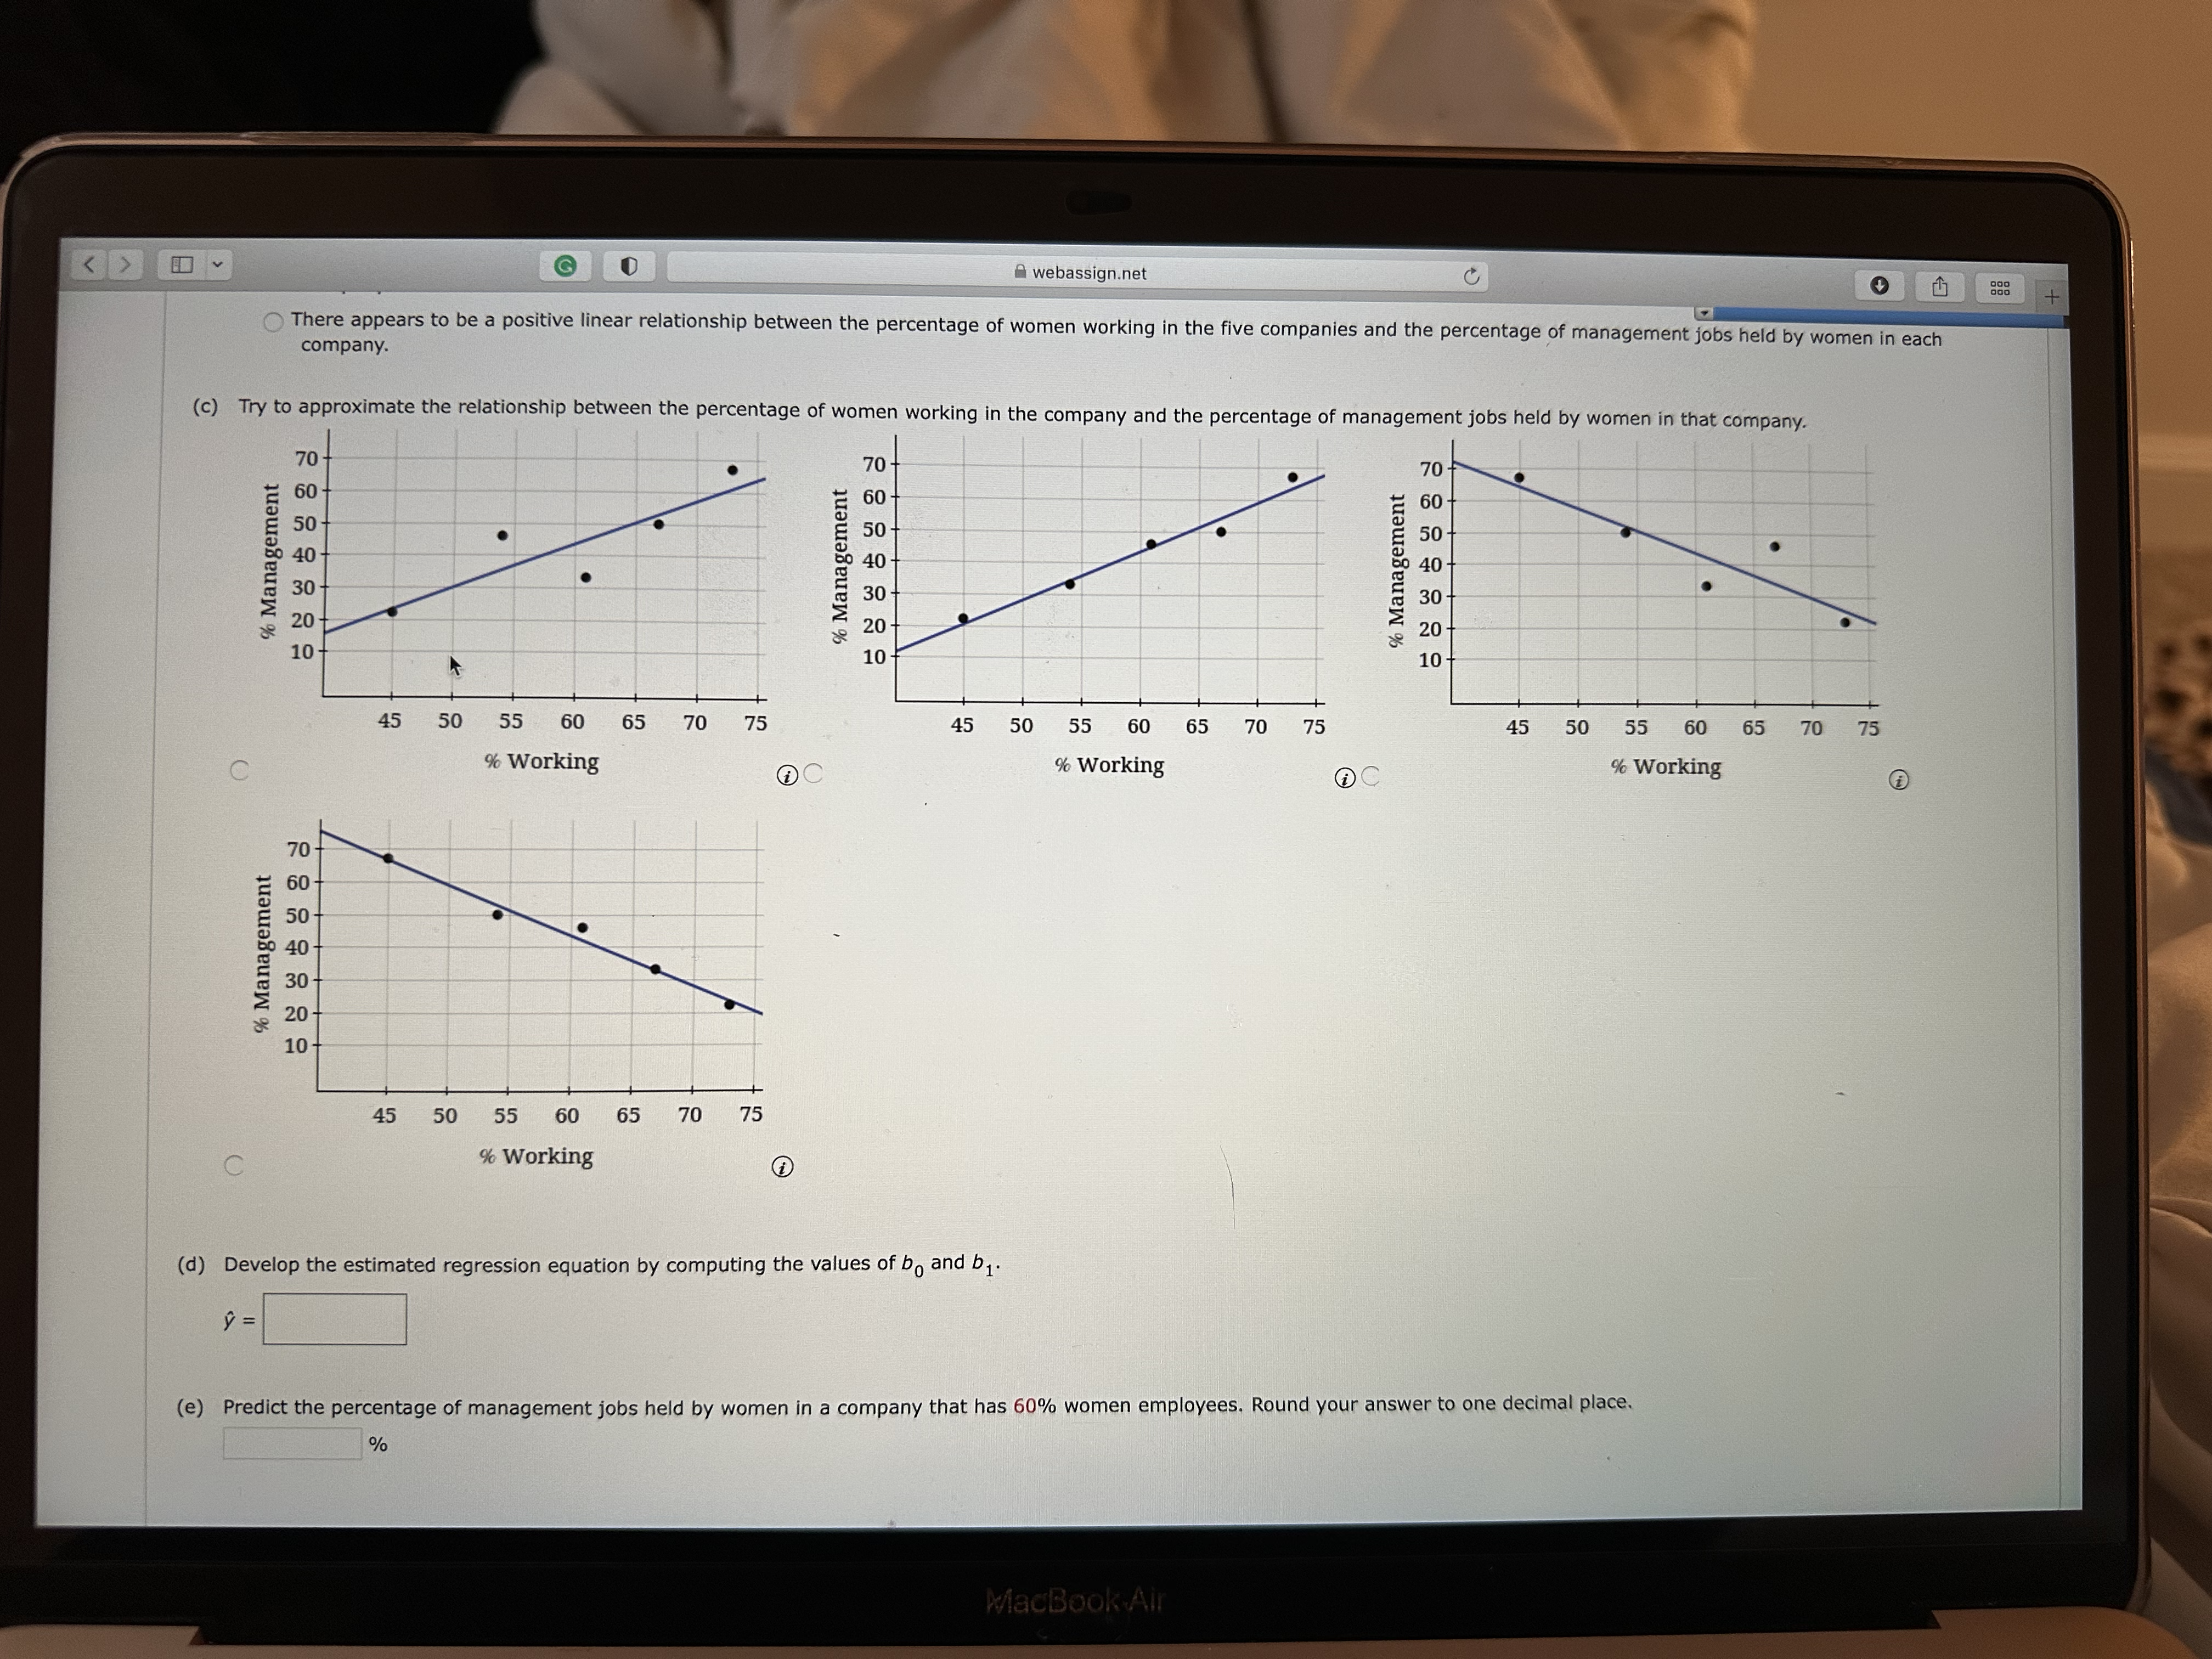
q v webassign.net C (b) What does the scatter diagram developed in part (a) indicate about the relationship between the two variables? There appears to be a negative linear relationship between the percentage of women working in the five companies and the percentage of management jobs held by women in each company. There appears to be no noticeable relationship between the percentage of women working in the five companies and the percentage of management jobs held by women in each company. There appears to be a positive linear relationship between the percentage of women working in the five companies and the percentage of management jobs held by women in each company. (c) Try to approximate the relationship between the percentage of women working in the company and the percentage of management jobs held by women in that company. 70 70 70 60 ment 50 - 50 - nagement 50- Management 40- 80 40 40 30 Manage 30 - 2 30- 20 20 20 10 10 10 - 45 50 55 60 65 70 75 45 50 55 65 70 75 45 50 55 60 65 70 75 Working Working % Working Management 10 - + 45 50 55 60 65 70 75 C Working (d) Develop the estimated regression equation by computing the values of bo and b1. y = MacBook Air webasslgnmet i 1'. [l10 Points] ASWSBE1414.E.004. The following data give the percentage of women working In five companies In the retail and trade industry. The percentage of management jobs held by women in each company is also shown; E\" Working 67 4s 73 54 61 ~\"In Management 50 22 67 46 33 (a) Develop a scatter diagram for these data with the percentage of women working In the company as the independent variable. '0 *7 c % Management 96 Management 70 E 60 E 50 I) E 40 30 E 2,? 20 10 4 l l 55 60 65 70 75 50 55 50 65 70 % Working (D /' 96 Working u: o: c 96 Management N .u H o 50 55 60 65 70 75 C 96 Working (D (b) What does the scatter diagram developed In part (a) indicate about the relauonshlp between the two variables? 0 There appears to be a negative linear relationshlp between the percentage of women working In the five companies and the percentage of managementjobs held hywomen In ea BY A webassign.net 1 4 808 There appears to be a positive linear relationship between the percentage of women working in the five companies and the percentage of management jobs held by women in each company. (c) Try to approximate the relationship between the percentage of women working in the company and the percentage of management jobs held by women in that company. 70 70- 70 60 60- 60 50- 50 50 Management 40- Management 40 % Management 40 30 30 30 20 20 20 10 10 10- 45 50 55 70 75 45 50 55 60 65 70 75 45 50 55 60 65 70 75 C Working % Working Working % Management 45 50 5 55 60 65 70 75 C % Working (d) Develop the estimated regression equation by computing the values of bo and b 1. Y = (e) Predict the percentage of management jobs held by women in a company that has 60% women employees. Round your answer to one decimal place. % MacBook Air
Step by Step Solution
There are 3 Steps involved in it

Get step-by-step solutions from verified subject matter experts