

Question: This project will use the logistic map: F(x) = rx(1-x), where x is an element in [0, 1] and r > 0, is the function
This project will use the logistic map:
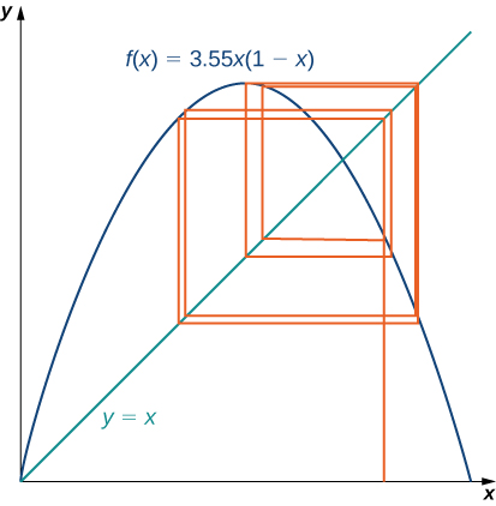
F(x) = rx(1-x), where x is an element in [0, 1] and r > 0,
is the function in our iterative process. The logistic map is a deceptively simple function; but, depending on the value of r, the resulting iterative process displays some very interesting behavior. It can lead to fixed points, cycles, and even chaos. To visualize the long-term behavior of the iterative process associated with the logistic map, we will use a tool called a cobweb diagram. As we did with the iterative process we examined earlier in this section, we first draw a vertical line from the point (x0, 0) to the point (x0, f(x0))=(x0, x1), and continue the process until the long-term behavior of the system becomes apparent. The figure below shows the long-term behavior of the logistic map when r= 3.55 and x0=0.2. (The first 100 iterations are not plotted.) The long-term behavior of this iterative process is an 8-cycle.
- Let r= 0.5 and choose x0=0.2. Using a spreadsheet (Excel or Google Sheets) that calculates the formula for you, calculate the first 10 values in the sequence. Insert the spreadsheet table below.
-
- State the formula entered into the spreadsheet:
- Does the sequence appear to:
- Converge? If so, to what value?
- Result in a cycle? If so, what is the period of the cycle?
- Insert spreadsheet table.
Step by Step Solution
There are 3 Steps involved in it

Get step-by-step solutions from verified subject matter experts