

Question: This question: 1 Sub point(s) possible The graph shows the velocity of a car from t = 0 to t = 12 seconds Find and
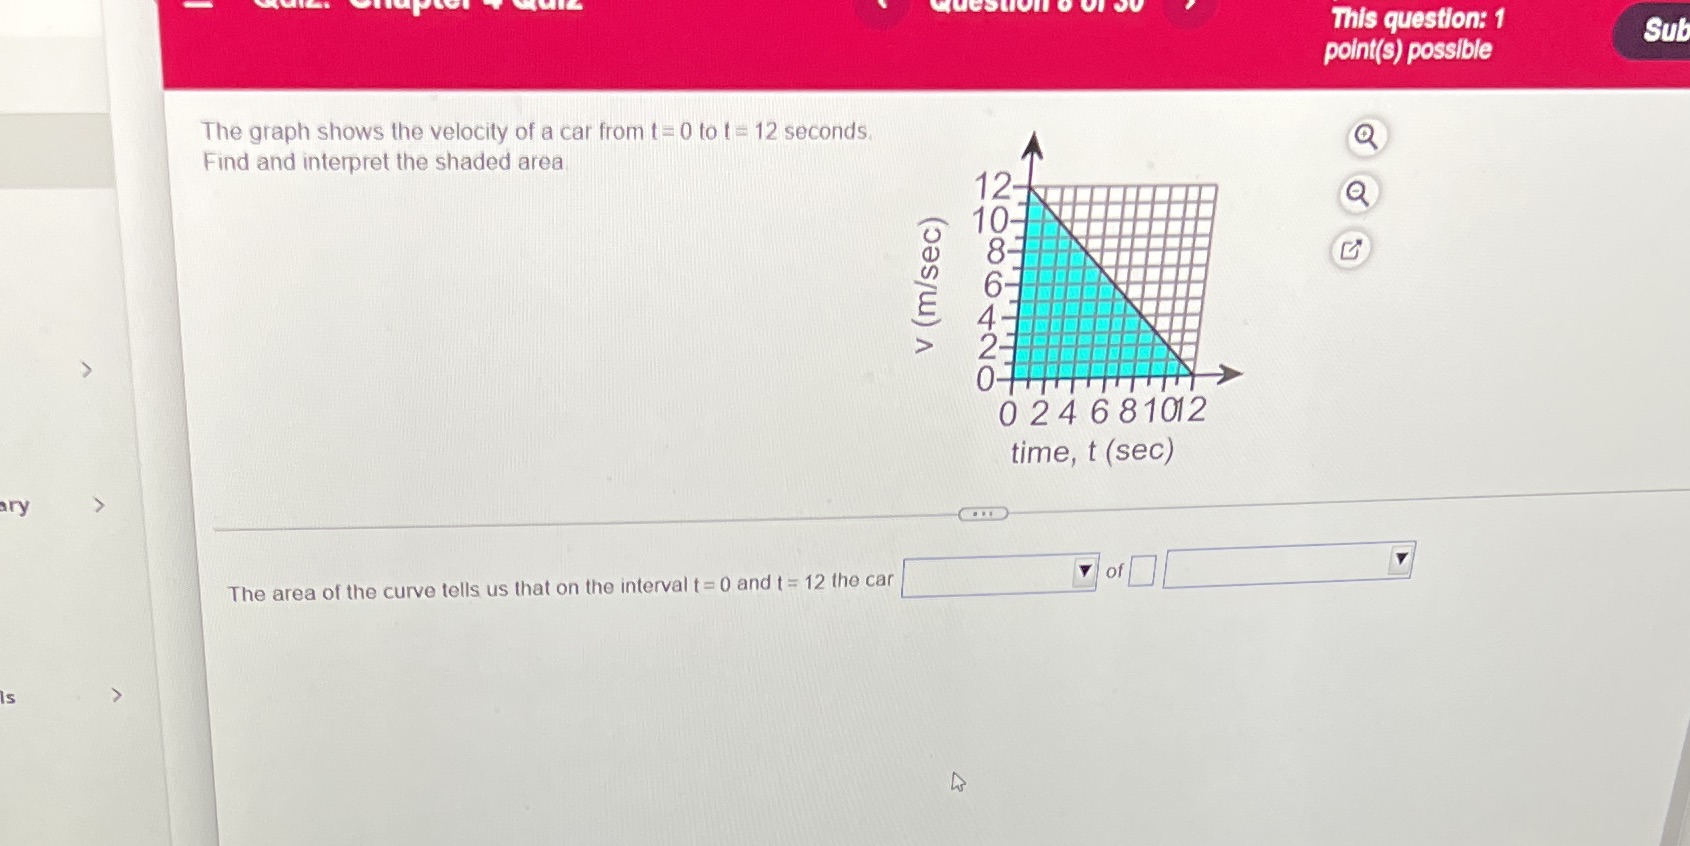
This question: 1 Sub point(s) possible The graph shows the velocity of a car from t = 0 to t = 12 seconds Find and interpret the shaded area 12- v (m/sec) ONDOOO 0 24 681012 time, t (sec) ary of The area of the curve tells us that on the interval t = 0 and t = 12 the car
Step by Step Solution
There are 3 Steps involved in it
1 Expert Approved Answer
Step: 1 Unlock

Question Has Been Solved by an Expert!
Get step-by-step solutions from verified subject matter experts
Step: 2 Unlock
Step: 3 Unlock