

Question: this question has been answered witn this data set before but i have different questions. Chap 10 Quality Management, Analytics Exercise: Tesla, Part B: Quality
this question has been answered witn this data set before but i have different questions. 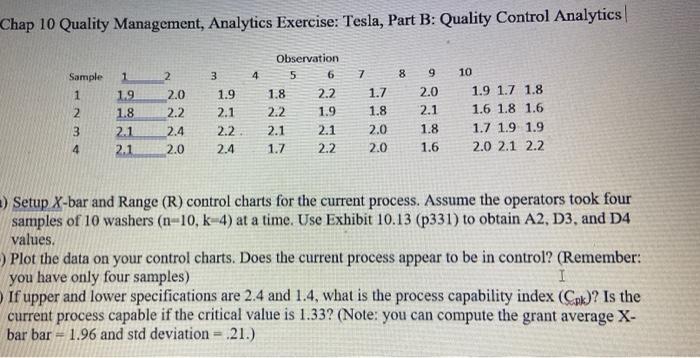
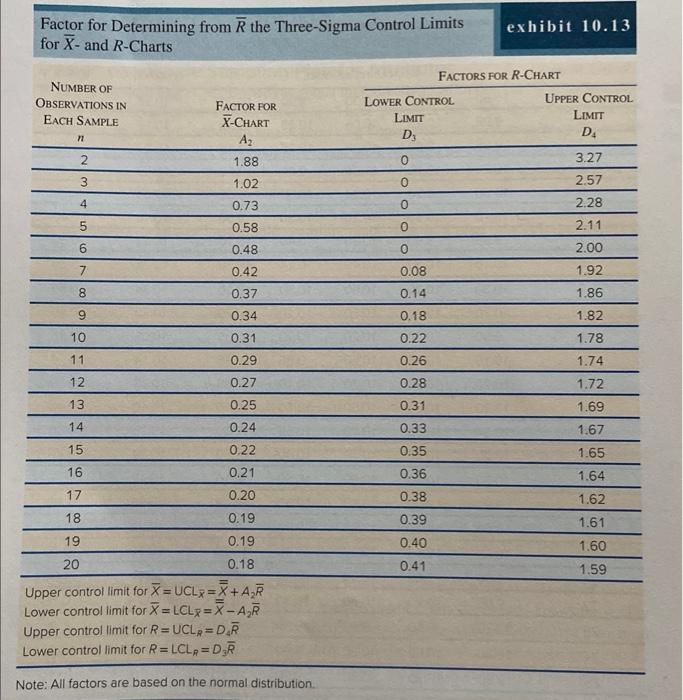
Chap 10 Quality Management, Analytics Exercise: Tesla, Part B: Quality Control Analytics Setup X-bar and Range (R) control charts for the current process. Assume the operators took four samples of 10 washers (n=10,k=4) at a time. Use Exhibit 10.13 (p331) to obtain A2, D3, and D4 values. Plot the data on your control charts. Does the current process appear to be in control? (Remember: you have only four samples) If upper and lower specifications are 2.4 and 1.4, what is the process capability index (Calk) ? Is the current process capable if the critical value is 1.33 ? (Note: you can compute the grant average Xbar bar =1.96 and std deviation =.21.) Lower control limit for X=LCL=XA2R Upper control limit for R=UCLR=D4R Lower control limit for R=LCL=D3R Note: All factors are based on the normal distribution
Step by Step Solution
There are 3 Steps involved in it
1 Expert Approved Answer
Step: 1 Unlock

Question Has Been Solved by an Expert!
Get step-by-step solutions from verified subject matter experts
Step: 2 Unlock
Step: 3 Unlock