

Question: This question is about Henry & Rogers - Response Complexity in motor learning and control. The chart below shows how reaction time (RT) is affected
This question is about Henry & Rogers - Response Complexity in motor learning and control.
The chart below shows how reaction time (RT) is affected by changes in movement complexity, via the response programming stage of information processing.
My question: Compare your results for the low vs. medium complexity condition. Were they consistent with the expected relationship as shown by Henry & Rogers? Explain how your results were affected by information processing.
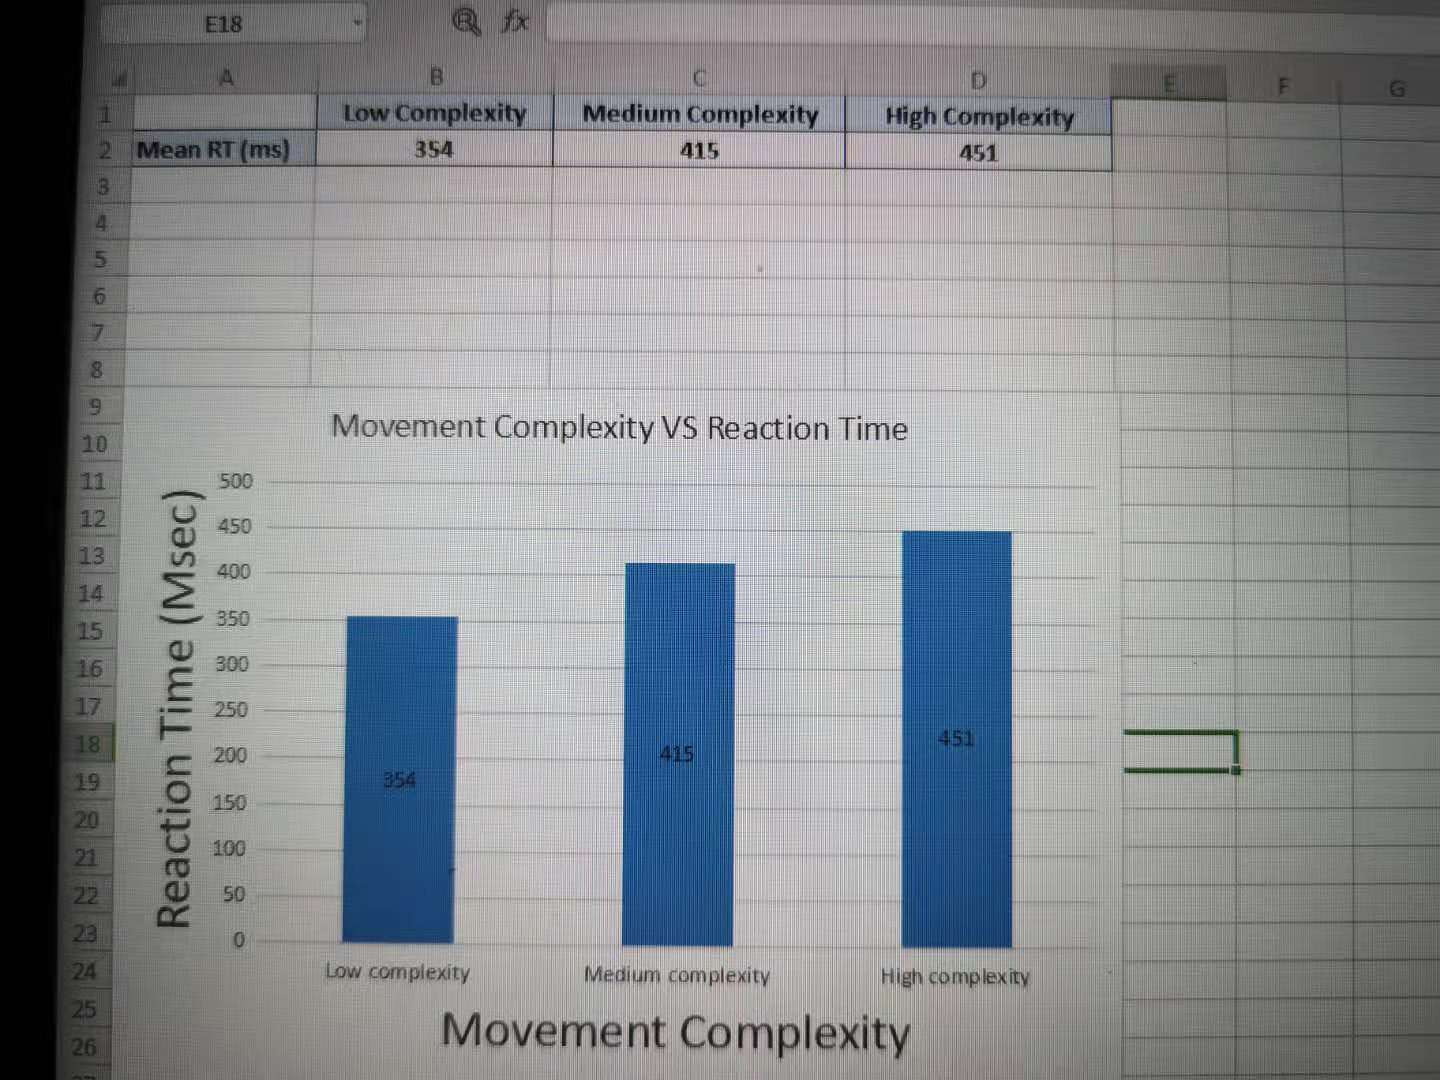
E18 B D G Low Complexity Medium Complexity High Complexity TH Mean RT (ms) 354 415 451 OUT Movement Complexity VS Reaction Time 10 11 500 12 450 13 400 14 350 15 16 300 17 Reaction Time (Msec) 250 200 415 254 150 100 50 Low complexity Medium complexity High complexity Movement Complexity
Step by Step Solution
There are 3 Steps involved in it

Get step-by-step solutions from verified subject matter experts