

Question: This question is answered by going into Google analytics demo account QUESTION Answer should be in this format IMPORTANT NOTE THIS ASSIGNMENT SHOULD BE DONE
This question is answered by going into Google analytics demo account
QUESTION


Answer should be in this format
IMPORTANT NOTE THIS ASSIGNMENT SHOULD BE DONE ONLY ON GOOGLE ANALYTICS
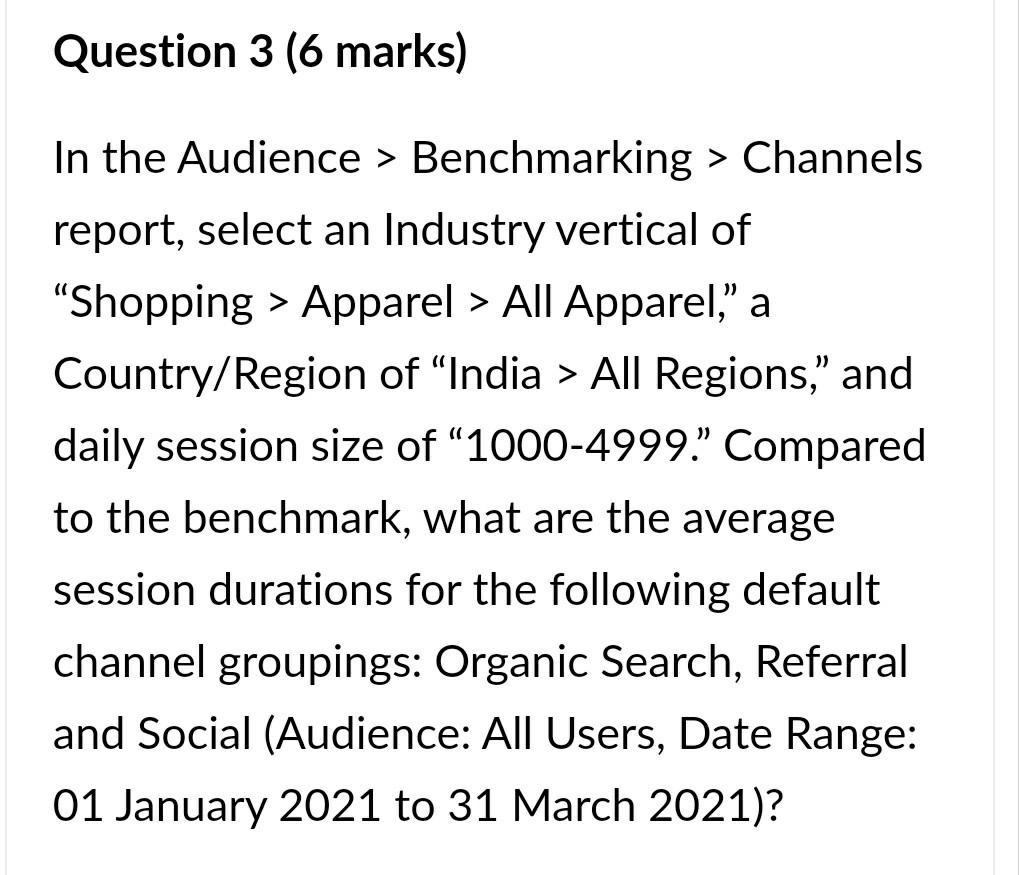
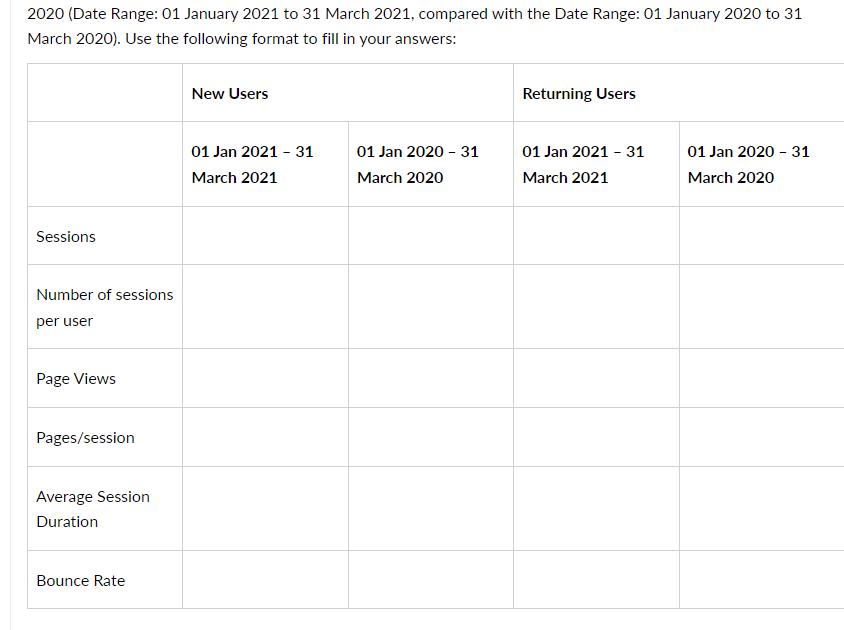
Section A - Analyzing information using Google Analytics (25 marks) Answer the following questions by going to the Google Analytics account of the Google Merchandise Store demoAccount). You will need to log in with your Google account USE A DATE RANGE OF 01 January 2021 to 31 March 2021 TO ANSWER THE QUESTIONS IN THIS SECTION YOUR ANSWERS TO EACH QUESTION SHOULD INCLUDE A SCREENSHOT OF THE REPORT VIEW EXTRACTED FROM GOOGLE ANALYTICS Question 3 (6 marks) In the Audience > Benchmarking > Channels report, select an Industry vertical of "Shopping > Apparel > All Apparel," a Country/Region of "India > All Regions," and daily session size of 1000-4999." Compared to the benchmark, what are the average session durations for the following default channel groupings: Organic Search, Referral and Social (Audience: All Users, Date Range: 01 January 2021 to 31 March 2021)? Question 3: Correctly drilling down to the appropriate report and reporting the 6 answer 2020 (Date Range: 01 January 2021 to 31 March 2021, compared with the Date Range: 01 January 2020 to 31 March 2020). Use the following format to fill in your answers: New Users Returning Users 01 Jan 2021 - 31 March 2021 01 Jan 2020 - 31 March 2020 01 Jan 2021 - 31 March 2021 01 Jan 2020 - 31 March 2020 Sessions Number of sessions per user Page Views Pages/session Average Session Duration Bounce Rate 1. Assessment Objective . Create report views and interpret segment and behavior related information from Google AnalyticsStep by Step Solution
There are 3 Steps involved in it
1 Expert Approved Answer
Step: 1 Unlock

Question Has Been Solved by an Expert!
Get step-by-step solutions from verified subject matter experts
Step: 2 Unlock
Step: 3 Unlock