Question: This tab is used for the corporate valuation report (Final Project). Enter data in the yellow cells only. CURRENCY: USD 2023 20241 2025 2026 2027
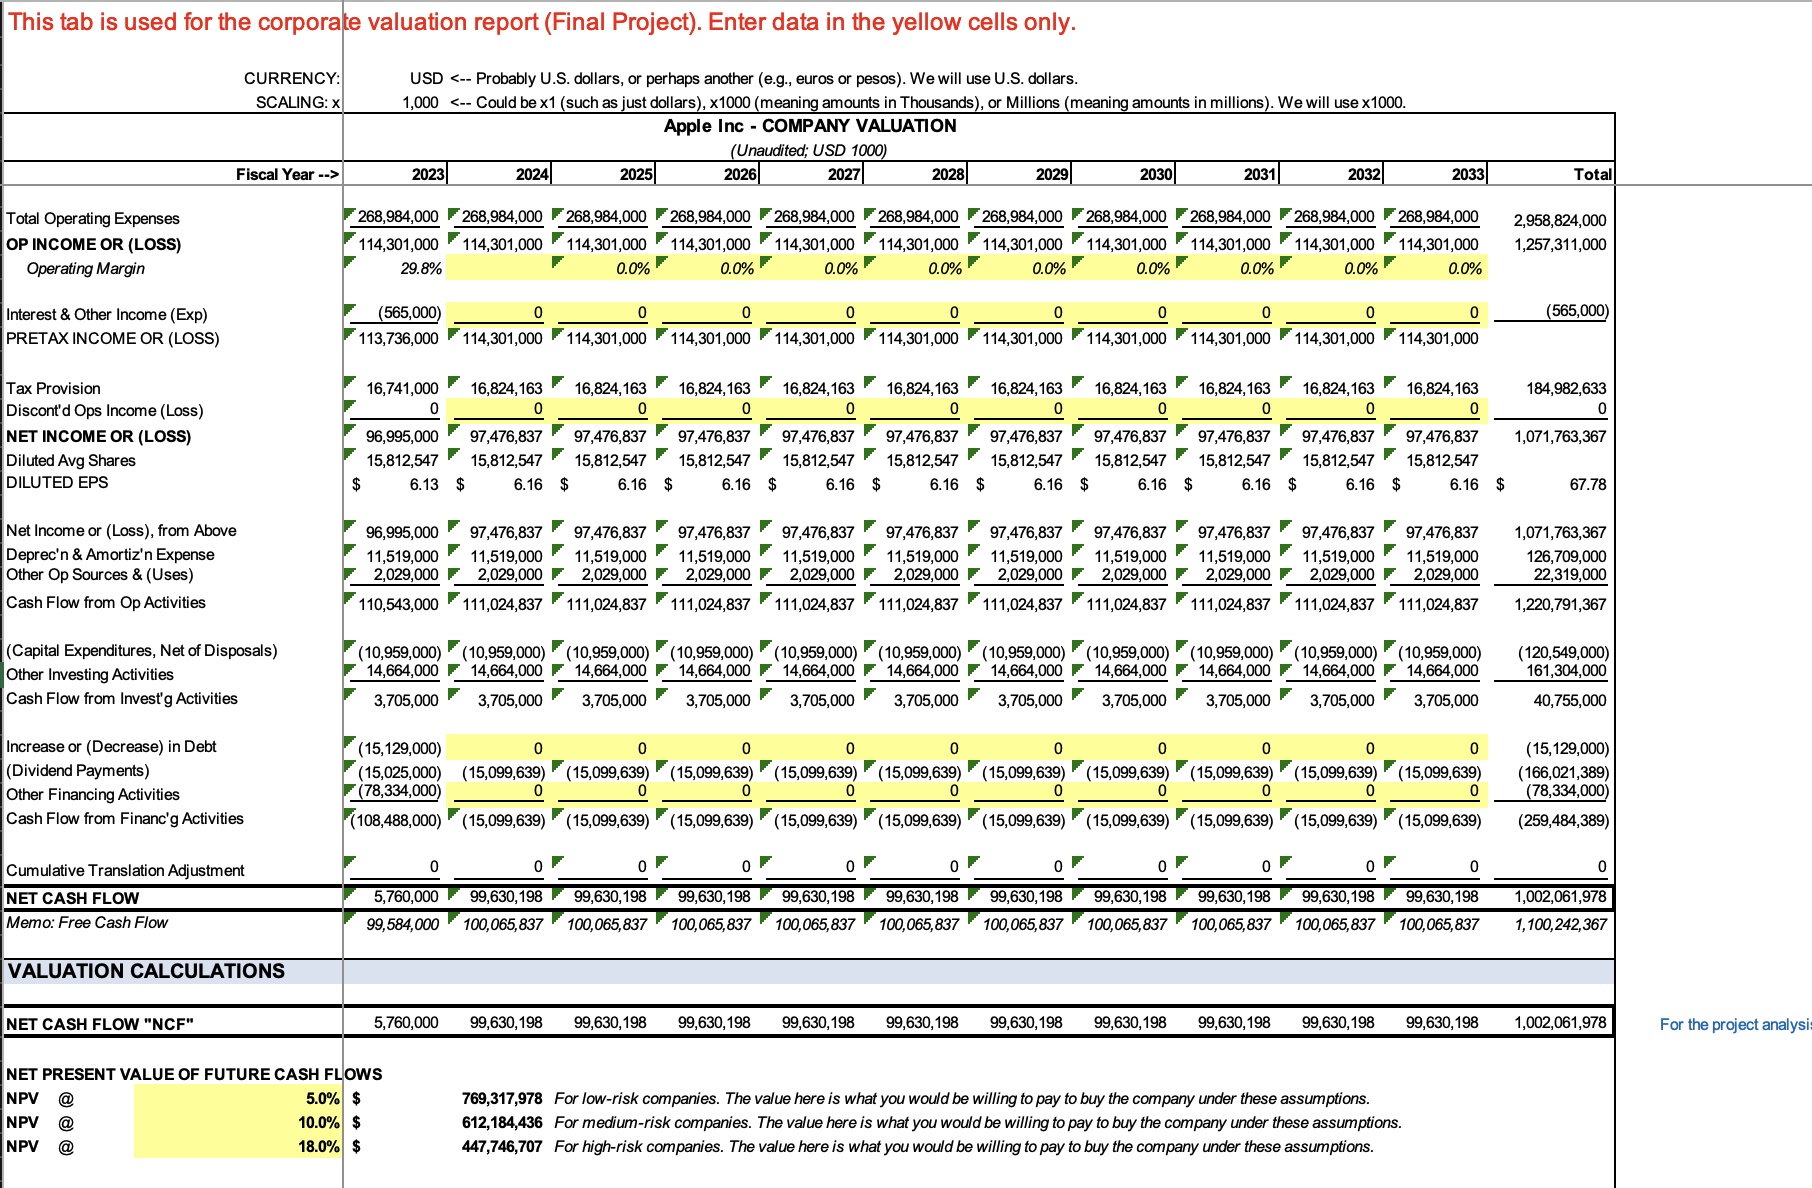
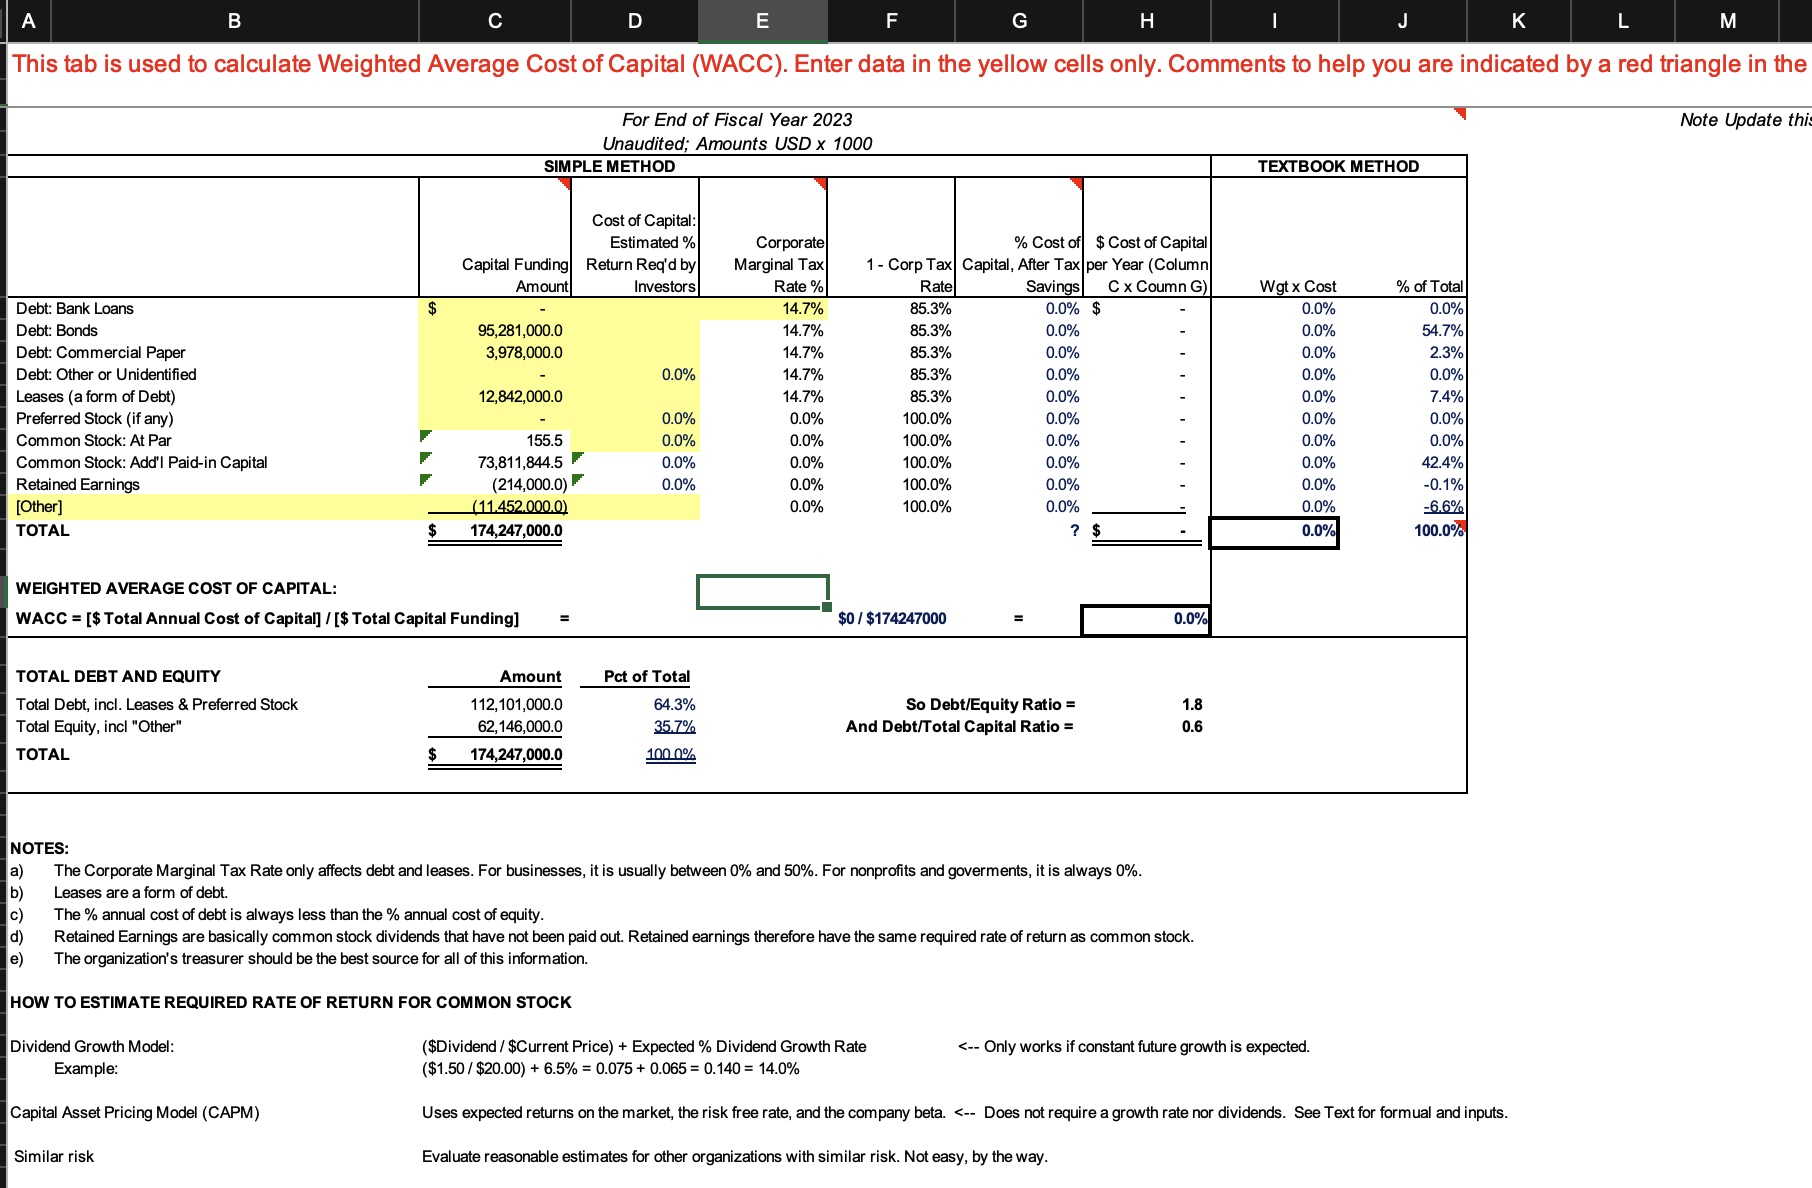
This tab is used for the corporate valuation report (Final Project). Enter data in the yellow cells only. CURRENCY: USD 2023 20241 2025 2026 2027 2028 2029 2030 2031 2032 2033 Total Total Operating Expenses 268,984,000 268,984,000 268,984,000 268,984,000 268,984,000 268,984,000 268,984,000 268,984,000 268,984,000 268,984,000 268,984,000 2,958,824,000 OP INCOME OR (LOSS) 114,301,000 114,301,000 114,301,000 114,301,000 114,301,000 114,301,000 114,301,000 114,301,000 114,301,000 114,301,000 114,301,000 1,257,311,000 Operating Margin 29.8% 0.0% 0.0% 0.0% 0.0% 0.0% 0.0% 0.0% 0.0% 0.0% Interest & Other Income (Exp) (565,000) 0 0 0 0 0 0 0 0 (565,000) PRETAX INCOME OR (LOSS) 113,736,000 114,301,000 114,301,000 114,301,000 114,301,000 114,301,000 114,301,000 114,301,000 114,301,000 114,301,000 114,301,000 Tax Provision 16,741,000 16,824,163 16,824,163 16,824,163 16,824,163 16,824,163 16,824,163 16,824,163 16,824,163 16,824,163 16,824,163 184,982,633 Discont'd Ops Income (Loss) NET INCOME OR (LOSS) 6,995,000 97,476,837 97,476,837 97,476,837 97,476,837 97,476,837 97,476,837 97,476,837 97,476,837 97,476,837 97,476,837 1,071,763,367 Diluted Avg Shares 15,812,547 15,812,547 15,812,547 15,812,547 15,812,547 15,812,547 15,812,547 15 15,812,547 15,812,547 1 15,812,547 15,812,547 DILUTED EPS 6.13 $ 6.16 $ 6.16 $ 6.16 $ 6.16 $ .16 $ 6.16 $ 6.16 $ 6.16 $ 5.16 $ 6.16 $ 67.78 Net Income or (Loss), from Above 96,995,000 97,476,837 97,476,837 97,476,837 97,476,837 97,476,837 97,476,837 97,476,837 97,476,837 97,476,837 97,476,837 1,071,763,367 Deprec'n & Amortiz'n Expense 11,519,000 11,519,000 11,519,000 11,519,000 11,519,000 11 11,519,000 11,519,000 11,519,000 11,519,000 11,519,000 11,519,000 26,709,000 Other Op Sources & (Uses 2,029,000 2,029,000 2,029,000 2,029,000 2 2,029,000 2,029,000 2,029,000 2,029,000 2,029,000 2,029,000 2,029,000 22,319,000 Cash Flow from Op Activities 110,543,000 111,024,837 111,024,837 111,024,837 111,024,837 111,024,837 111,024,837 111,024,837 111,024,837 111,024,837 111,024,837 1,220,791,367 Capital Expenditures, Net of Disposals) (10,959,000) (10,959,000) (10,959,000) (10,959,000) (10,959,000) (10,959,000) (10,959,000) (10,959,000) (10,959,000) (10,959,000) (10,959,000) (120,549,000) Other Investing Activities 14,664,000 14,664,000 14,664,000 14,664,000 14,664,000 14,664,000 14,664,000 14,664,000 14,664,000 14,664,000 14,664,000 161,304,000 Cash Flow from Invest'g Activities 3,705,000 3,705,000 3,705,000 3,705,000 3,705,000 3,705,000 3,705,000 3,705,000 3,705,000 3,705,000 3,705,000 40,755,000 Increase or (Decrease) in Debt (15, 129,000) 0 0 0 (15, 129,000) Dividend Payments (15,025,000) (15,099,639) (15,099,639) (15,099,639) (15,099,639) (15,099,639) (15,099,639) (15,099,639) (15,099,639) (15,099,639) (15,099,639) (166,021,389) Other Financing Activities (78,334,000) C 0 (78,334,000) Cash Flow from Financ'g Activities (108,488,000) (15,099,639) (15,099,639) (15,099,639) (15,099,639) (15,099,639) (15,099,639) (15,099,639) (15,099,639) (15,099,639) (15,099,639) (259,484,389) Cumulative Translation Adjustment NET CASH FLOW 5,760,000 99,630, 198 99,630, 198 99,630, 198 99,630,198 99,630, 198 99,630, 198 99,630, 198 99,630, 198 99,630, 198 99,630, 198 ,002,061,978 Memo: Free Cash Flow 99,584,000 100,065,837 100,065,837 100,065,837 100,065,837 100,065,837 100,065,837 100,065,837 100,065,837 100,065,837 100,065,837 1, 100,242,367 VALUATION CALCULATIONS NET CASH FLOW "NCF" 5,760,000 99,630, 198 99,630, 198 99,630, 198 99,630, 198 99,630, 198 99,630, 198 99,630, 198 99,630, 19 99,630, 198 99,630, 198 ,002,061,978 For the project analys NET PRESENT VALUE OF FUTURE CASH FLOWS NPV @ 5.0% $ 769,317,978 For low-risk companies. The value here is what you would be willing to pay to buy the company under these assumptions. NPV @ 10.0% $ 612, 184,436 For medium-risk companies. The value here is what you would be willing to pay to buy the company under these assumptions. NPV @ 18.0% $ 447,746,707 For high-risk companies. The value here is what you would be willing to pay to buy the company under these assumptions.I . B |9 D = ] ;| | i K L This tab is used to calculate Weighted Average Cost of Capital (WACC). Enter data in the yellow cells only. Comments to help you are indicated by a red triangle in the For End of Fiscal Year 2023 X TEXTBOOK METHOD Unaudited; Amounts USD x 1000 SIMPLE METHOD Cost of Capital: Estimated % Corporate Capital Funding| Return Req'd by Marginal Tax 1- Corp Tax| Capital, Debt: Bank Loans - Debt: Bonds 95,281,000.0 14.7% 85.3% Debt: Commercial Paper 3,978,000.0 14.7% 85.3% Debt: Other or Unidentified - 0.0% 14.7% 85.3% Leases (a form of Debt) 12,842,000.0 14.7% 85.3% Preferred Stock (if any) - 0.0% 0.0% 100.0% Common Stock: At Par F 155.5 0.0% 0.0% 100.0% Common Stock: Add'| Paid-in Capital F 738118445 F 0.0% 0.0% 100.0% Retained Earnings F (214,000.0) F 0.0% 0.0% 100.0% [Other] (11.452.000.0) 0.0% 100.0% TOTAL $ 174,247,000.0 WEIGHTED AVERAGE COST OF CAPITAL: n WACC = [$ Total Annual Cost of Capital] / [$ Total Capital Funding] $0 / $174247000 TOTAL DEBT AND EQUITY Amount Pct of Total Total Debt, incl. Leases & Preferred Stock 112,101,000.0 64.3% So Debt/Equity Ratio = 18 Total Equity, incl "Other" 62,146,000.0 30.7% And Debt/Total Capital Ratio = 086 TOTAL $ 174,247,000.0 1000% NOTES: a) The Corporate Marginal Tax Rate only affects debt and leases. For businesses, it is usually between 0% and 50%. For nonprofits and goverments, it is always 0%. b) Leases are aform of debt. ) The % annual cost of debt is always less than the % annual cost of equity. d) Retained Earnings are basically common stock dividends that have not been paid out. Retained earnings therefore have the same required rate of return as common stock. ) The organization's treasurer should be the best source for all of this information. HOW TO ESTIMATE REQUIRED RATE OF RETURN FOR COMMON STOCK Dividend Growth Model: ($Dividend / $Current Price) + Expected % Dividend Growth Rate
Step by Step Solution
There are 3 Steps involved in it
1 Expert Approved Answer
Step: 1 Unlock
Question Has Been Solved by an Expert!
Get step-by-step solutions from verified subject matter experts
Step: 2 Unlock
Step: 3 Unlock
Students Have Also Explored These Related Accounting Questions!