

Question: This table, contains the annual returns from 2008 to 2017 for two stocks, Consolidated Edison (ED) and Central Valley Community Bancor (CVCY). The annual returns
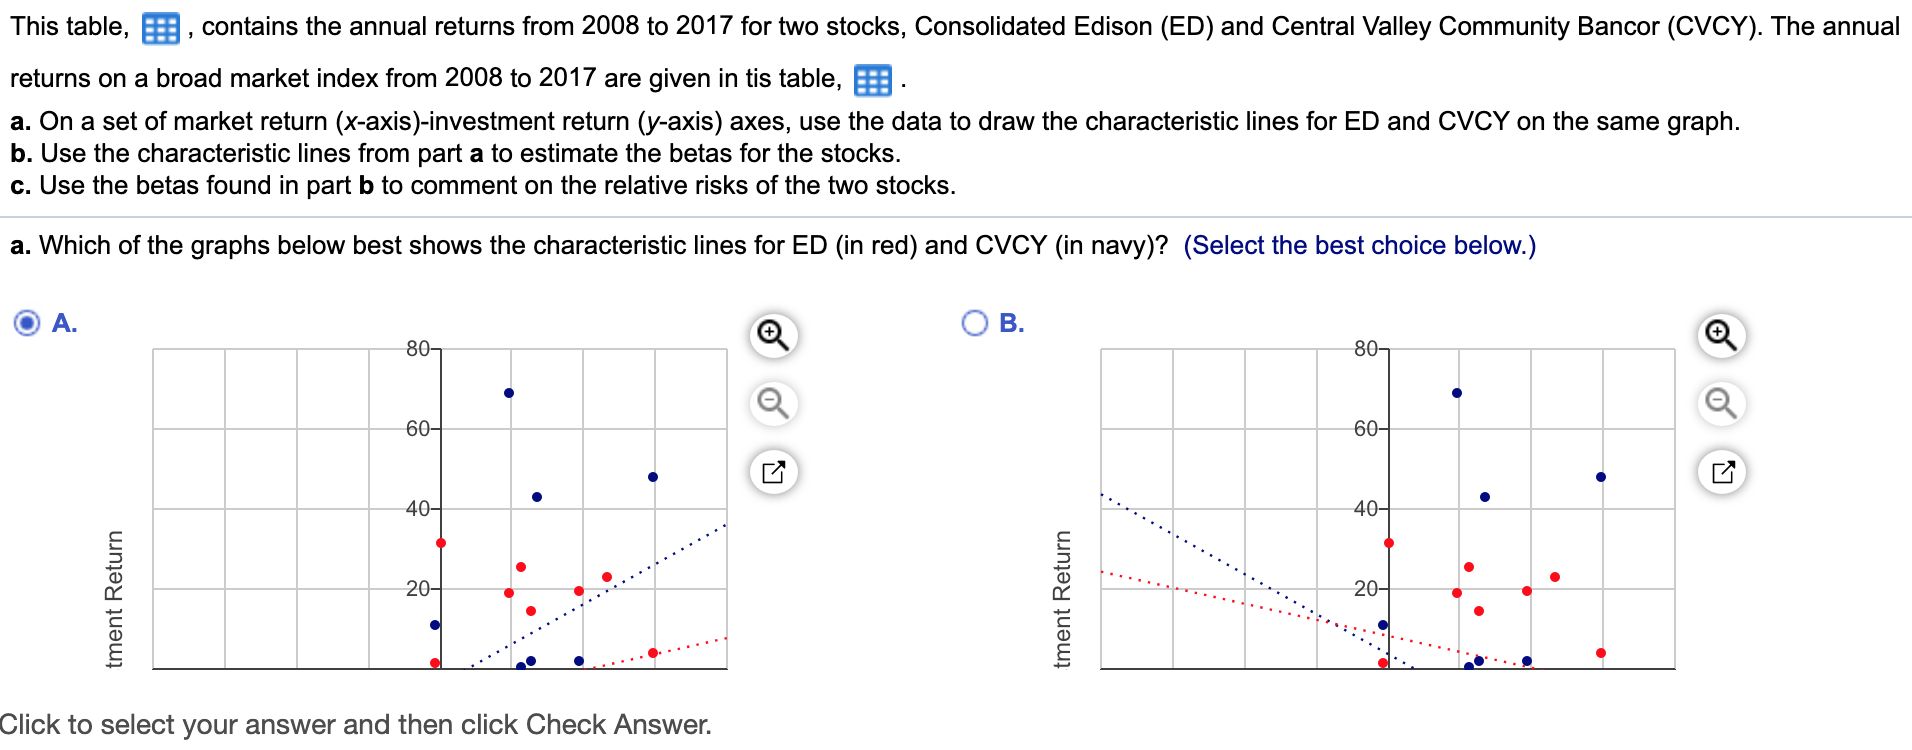
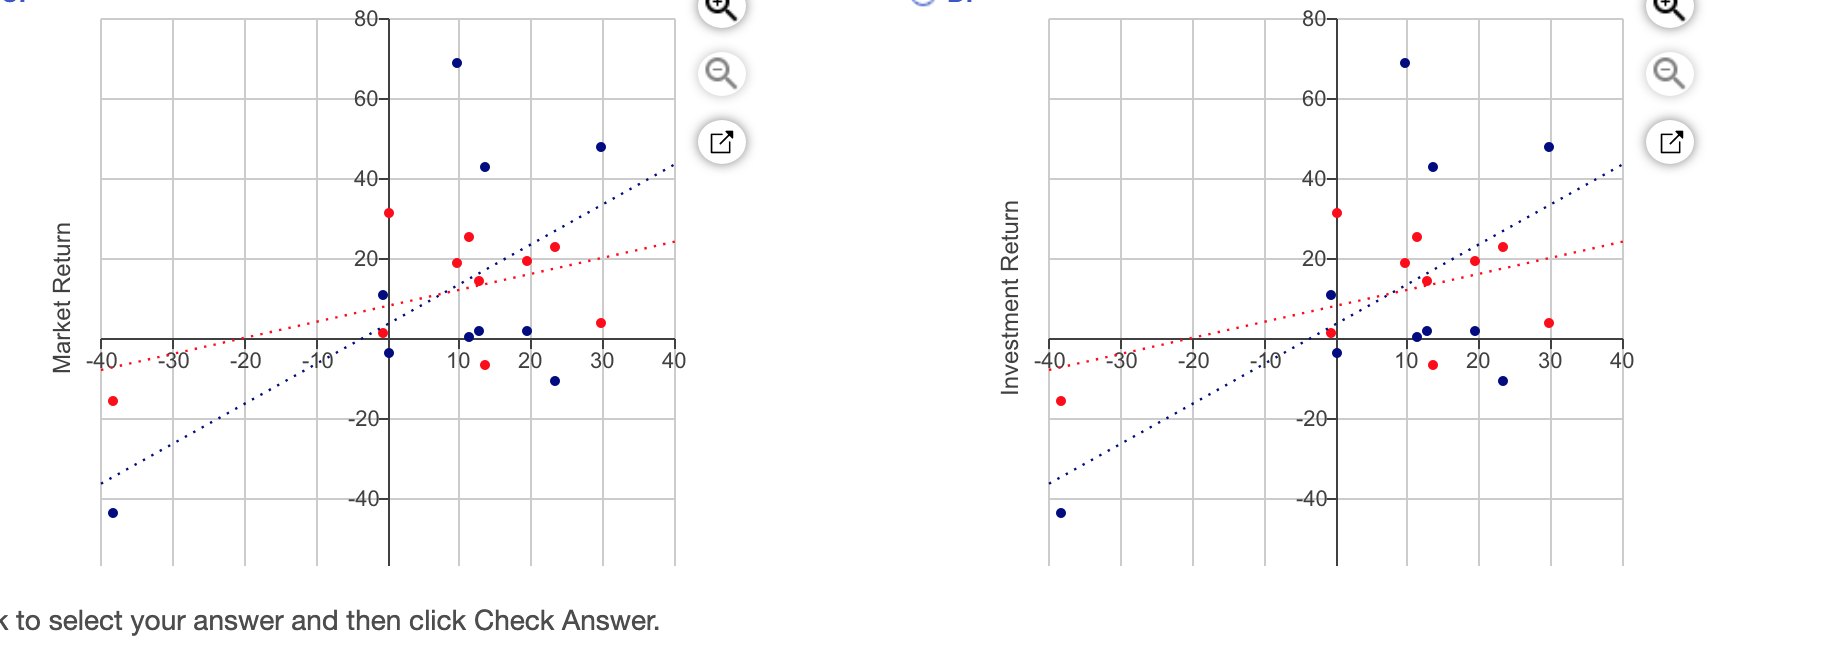
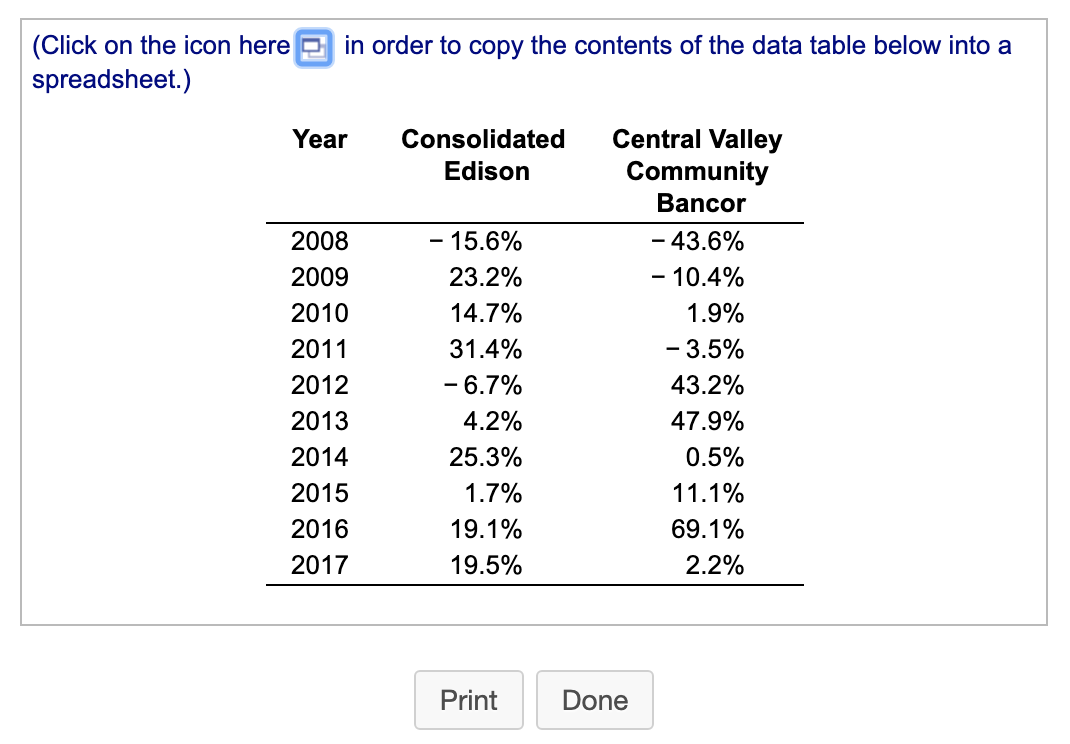
This table, contains the annual returns from 2008 to 2017 for two stocks, Consolidated Edison (ED) and Central Valley Community Bancor (CVCY). The annual returns on a broad market index from 2008 to 2017 are given in tis table, E:. a. On a set of market return (x-axis)-investment return (y-axis) axes, use the data to draw the characteristic lines for ED and CVCY on the same graph. b. Use the characteristic lines from part a to estimate the betas for the stocks. c. Use the betas found in part b to comment on the relative risks of the two stocks. a. Which of the graphs below best shows the characteristic lines for ED (in red) and CVCY (in navy)? (Select the best choice below.) OA. OB. O O O tment Return tment Return Click to select your answer and then click Check Answer. Market Return Investment Return -40....-30** **-2010. 10. 20 30 40 40.... --30 ***-2010 10. 20 30 40
Step by Step Solution
There are 3 Steps involved in it

Get step-by-step solutions from verified subject matter experts