

Question: This table, contains the annual returns from 2008 to 2017 for two stocks, Consolidated Edison (ED) and Central Valley Community Bancor (CVCY). Use Excel to
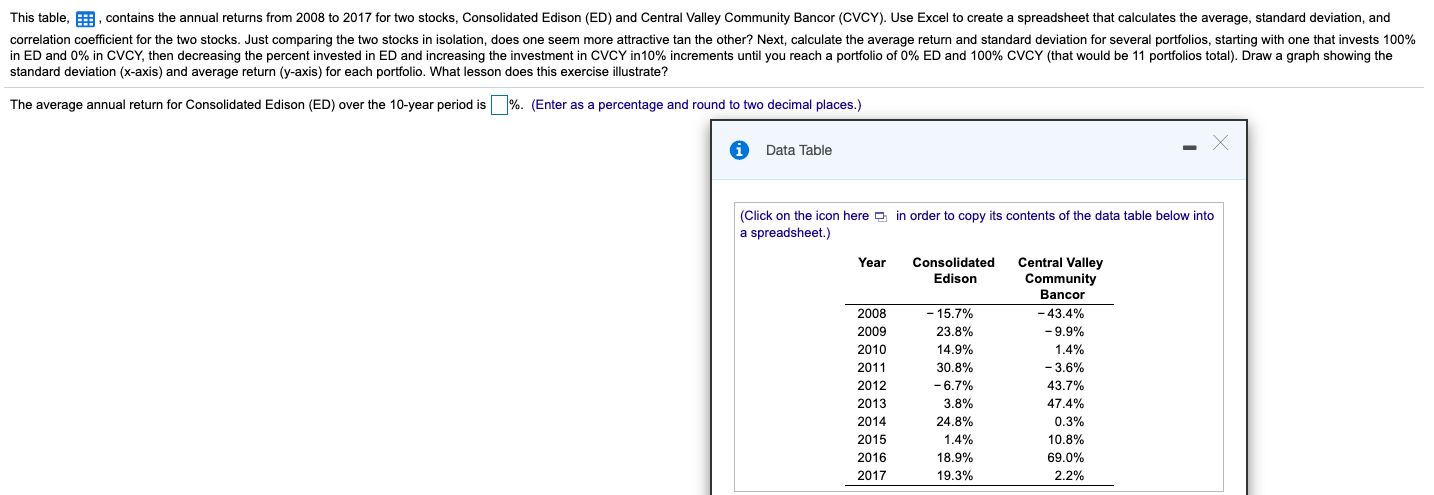
This table, contains the annual returns from 2008 to 2017 for two stocks, Consolidated Edison (ED) and Central Valley Community Bancor (CVCY). Use Excel to create a spreadsheet that calculates the average, standard deviation, and correlation coefficient for the two stocks. Just comparing the two stocks in isolation, does one seem more attractive tan the other? Next, calculate the average return and standard deviation for several portfolios, starting with one that invests 100% in ED and 0% in CVCY, then decreasing the percent invested in ED and increasing the investment in CVCY in 10% increments until you reach a portfolio of 0% ED and 100% CVCY (that would be 11 portfolios total). Draw a graph showing the standard deviation (x-axis) and average return (y-axis) for each portfolio. What lesson does this exercise illustrate? The average annual return for Consolidated Edison (ED) over the 10-year period is %. (Enter as a percentage and round to two decimal places.) i Data Table in order to copy its contents of the data table below into (Click on the icon here a spreadsheet.) Year Consolidated Edison 2008 2009 2010 2011 2012 2013 2014 2015 2016 2017 - 15.7% 23.8% 14.9% 30.8% -6.7% 3.8% 24.8% 1.4% 18.9% 19.3% Central Valley Community Bancor - 43.4% -9.9% 1.4% -3.6% 43.7% 47.4% 0.3% 10.8% 69.0% 2.2% This table, contains the annual returns from 2008 to 2017 for two stocks, Consolidated Edison (ED) and Central Valley Community Bancor (CVCY). Use Excel to create a spreadsheet that calculates the average, standard deviation, and correlation coefficient for the two stocks. Just comparing the two stocks in isolation, does one seem more attractive tan the other? Next, calculate the average return and standard deviation for several portfolios, starting with one that invests 100% in ED and 0% in CVCY, then decreasing the percent invested in ED and increasing the investment in CVCY in 10% increments until you reach a portfolio of 0% ED and 100% CVCY (that would be 11 portfolios total). Draw a graph showing the standard deviation (x-axis) and average return (y-axis) for each portfolio. What lesson does this exercise illustrate? The average annual return for Consolidated Edison (ED) over the 10-year period is %. (Enter as a percentage and round to two decimal places.) i Data Table in order to copy its contents of the data table below into (Click on the icon here a spreadsheet.) Year Consolidated Edison 2008 2009 2010 2011 2012 2013 2014 2015 2016 2017 - 15.7% 23.8% 14.9% 30.8% -6.7% 3.8% 24.8% 1.4% 18.9% 19.3% Central Valley Community Bancor - 43.4% -9.9% 1.4% -3.6% 43.7% 47.4% 0.3% 10.8% 69.0% 2.2%
Step by Step Solution
There are 3 Steps involved in it

Get step-by-step solutions from verified subject matter experts