

Question: this table - Step 2: Find a statistic from the tables at the close of the report that you find especially interesting or surprising to
 this table
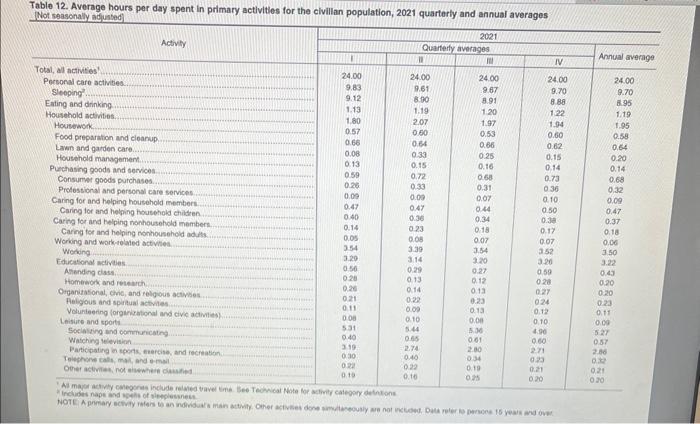
- Step 2: Find a statistic from the tables at the close of the report that you find especially interesting or surprising to share with the group. Be sure to tell us which table in the report (e.g., Table 4) your stat is from. In addition to reporting the statistic, be sure to describe the variable and population it represents. Then, apply what you learned recently to assess the representativeness of this statistic given that they have not reported a specific measure of variability and that we don't know the shape or skew of the data. Consider how this data might be used, for example by employers or policy makers. Table 12. Average hours per day spent in primary activities for the civillan population, 2021 quarterly and annual averages (Not seasonally adjusted) - Step 2: Find a statistic from the tables at the close of the report that you find especially interesting or surprising to share with the group. Be sure to tell us which table in the report (e.g., Table 4) your stat is from. In addition to reporting the statistic, be sure to describe the variable and population it represents. Then, apply what you learned recently to assess the representativeness of this statistic given that they have not reported a specific measure of variability and that we don't know the shape or skew of the data. Consider how this data might be used, for example by employers or policy makers. Table 12. Average hours per day spent in primary activities for the civillan population, 2021 quarterly and annual averages (Not seasonally adjusted)
Step by Step Solution
There are 3 Steps involved in it

Get step-by-step solutions from verified subject matter experts