

Question: Three months later . . . . . . You want to check whether the process is still in control and ask Sam to collect
Three months later
You want to check whether the process is still in control and ask Sam to collect more data from the production line. Sam collects samples and, following your instruction, in each sample, products are examined.
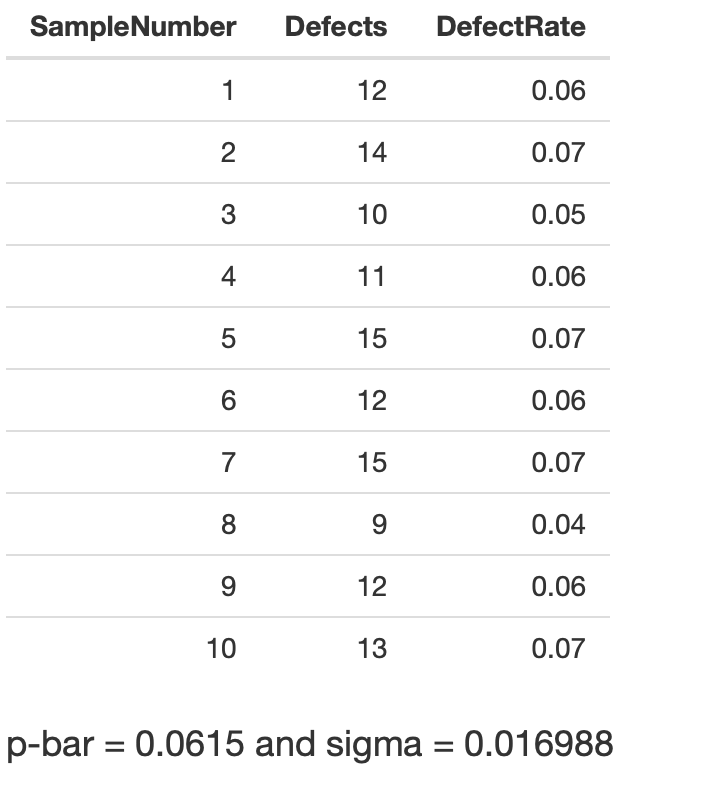
Now go to Tab P and click "Show me the data". The data Sam just collected Dataset is shown in this table. The first column is the sample number, the second column is the number of defects in each sample, and the third column is the defect rate. Sam again has helped you to calculate pbar and sigma values.
To plot the data against the control limits please inform Sam which dataset will be used for building the control chart. Is it Dataset Dataset or Dataset In addition, please inform Sam which parameter should be plotted on the yaxis pbar, sigma, or p:
Now go back to Tab P on the left side of the screen, please input the values your calculated earlier for the center line and two control limits Using your inputs and Dataset collected by Sam, the program helps you generate a control chart.
Looking at the chart, do you think the process is in still control? Why?
Youve solved all the problems, so you decide to help other managers in your team who are still trying to figure out their answers
Step by Step Solution
There are 3 Steps involved in it
1 Expert Approved Answer
Step: 1 Unlock

Question Has Been Solved by an Expert!
Get step-by-step solutions from verified subject matter experts
Step: 2 Unlock
Step: 3 Unlock