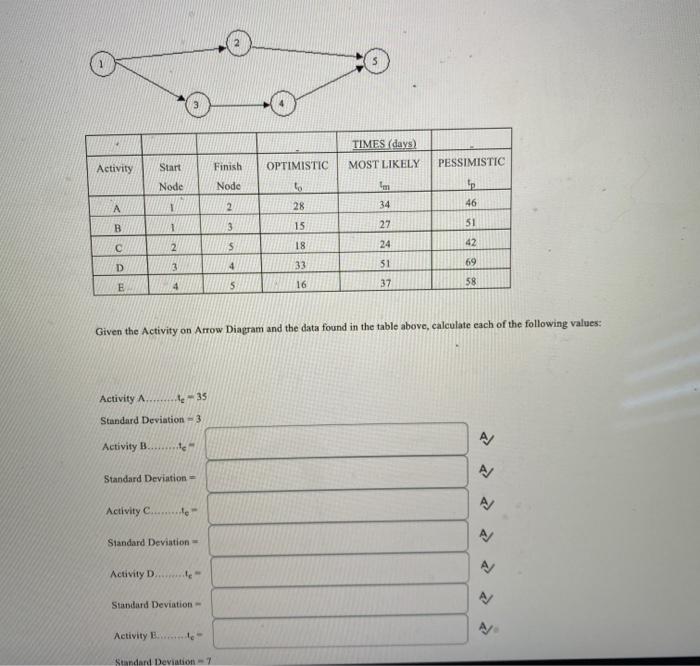
Question: TIMES (days) MOST LIKELY Activity Start Finish OPTIMISTIC PESSIMISTIC Node Node to m top 46 A 2 34 28 51 B 1 3 15 27

TIMES (days) MOST LIKELY Activity Start Finish
TIMES (days) MOST LIKELY Activity Start Finish OPTIMISTIC PESSIMISTIC Node Node to m top 46 A 2 34 28 51 B 1 3 15 27 C 2 s 18 24 42 D 3 4 33 69 51 E 5 16 37 58 4 Given the Activity on Arrow Diagram and the data found in the table above, calculate each of the following values: Activity A 1-35 Standard Deviation - 3 DJ Activity B 1 Standard Deviation A/ Activity C Standard Deviation A/ Activity D...e Standard Deviation- Activity E... - Standard Deviation - 7 Path 1 2-5 Mean Time 4 Standard Deviation - 5 Path 1-3-4-5 A/ Mean Time Standard Deviation

Step by Step Solution

There are 3 Steps involved in it

1 Expert Approved Answer
Step: 1 Unlock blur-text-image
Question Has Been Solved by an Expert!

Get step-by-step solutions from verified subject matter experts

Step: 2 Unlock
Step: 3 Unlock

Students Have Also Explored These Related General Management Questions!