

Question: To plot a figure of a function y=f(t) in an interval a and b in MATLAB, one should find n-1 points of t between a
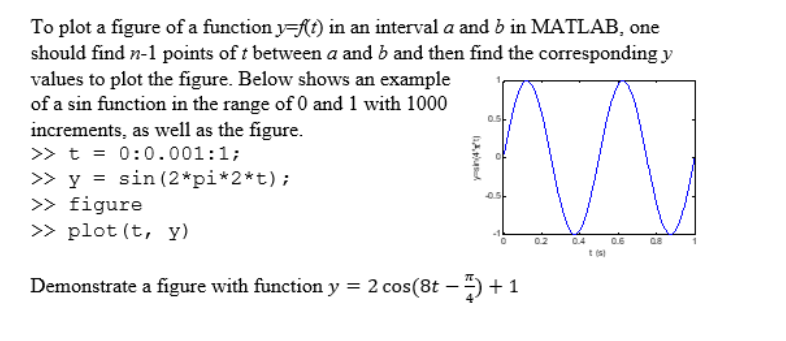
To plot a figure of a function y=f(t) in an interval a and b in MATLAB, one should find n-1 points of t between a and b and then find the corresponding y values to plot the figure. Below shows an example of a sin function in the range of 0 and 1 with 1000 increments, as well as the figure. >> t = 0:0.001:1; >> y = sin(2*pi*2*t); >> figure >> plot(t, y) RAMA 0 0 2 0.4 0.6 0.8 Demonstrate a figure with function y = 2 cos(
Step by Step Solution
There are 3 Steps involved in it
1 Expert Approved Answer
Step: 1 Unlock

Question Has Been Solved by an Expert!
Get step-by-step solutions from verified subject matter experts
Step: 2 Unlock
Step: 3 Unlock