

Question: To plot a function of two variables, z = f(x,y), we need to have matrices of independent variable values for all of the (x,y) coordinate
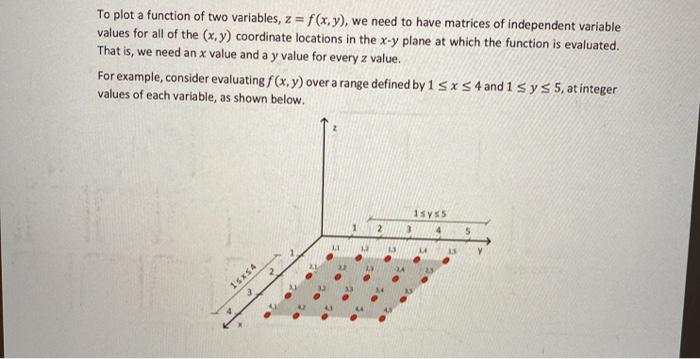
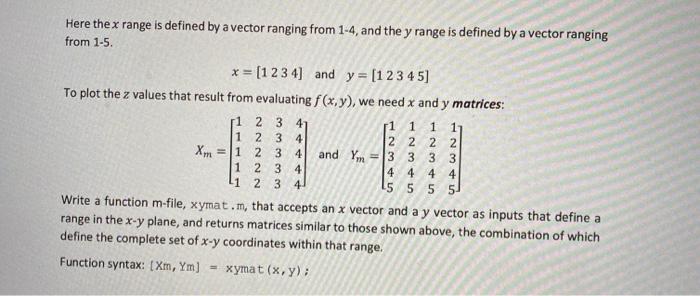
To plot a function of two variables, z = f(x,y), we need to have matrices of independent variable values for all of the (x,y) coordinate locations in the x-y plane at which the function is evaluated. That is, we need an x value and a y value for every z value. For example, consider evaluating f(x,y) over a range defined by 1 Sxs 4 and 1 sy s 5, at integer values of each variable, as shown below. 1syss 3 5 LI 14 15x4 1 1 1 Here the x range is defined by a vector ranging from 1-4, and the y range is defined by a vector ranging from 1-5. * = [1 2 3 4] and y = [1 2 3 4 5] To plot the z values that result from evaluating f(x,y), we need x and y matrices: 1 2 3 4 1 1 2 3 4 22 2 2 X = 1 2 3 4 and Ym 3 3 33 1 2 3 44 4 4 2 3 4 5 5 5 5 Write a function m-file, xymat.m, that accepts an x vector and a y vector as inputs that define a range in the x-y plane, and returns matrices similar to those shown above, the combination of which define the complete set of x-y coordinates within that range. Function syntax: [Xm, Ym) = xymat (x,y): 4 1
Step by Step Solution
There are 3 Steps involved in it

Get step-by-step solutions from verified subject matter experts