

Question: To summarize and analyze data with both a crosstabulation and charting, Excel typically pairs stacked column charts with PivotTables heat maps with trendlines bubble charts
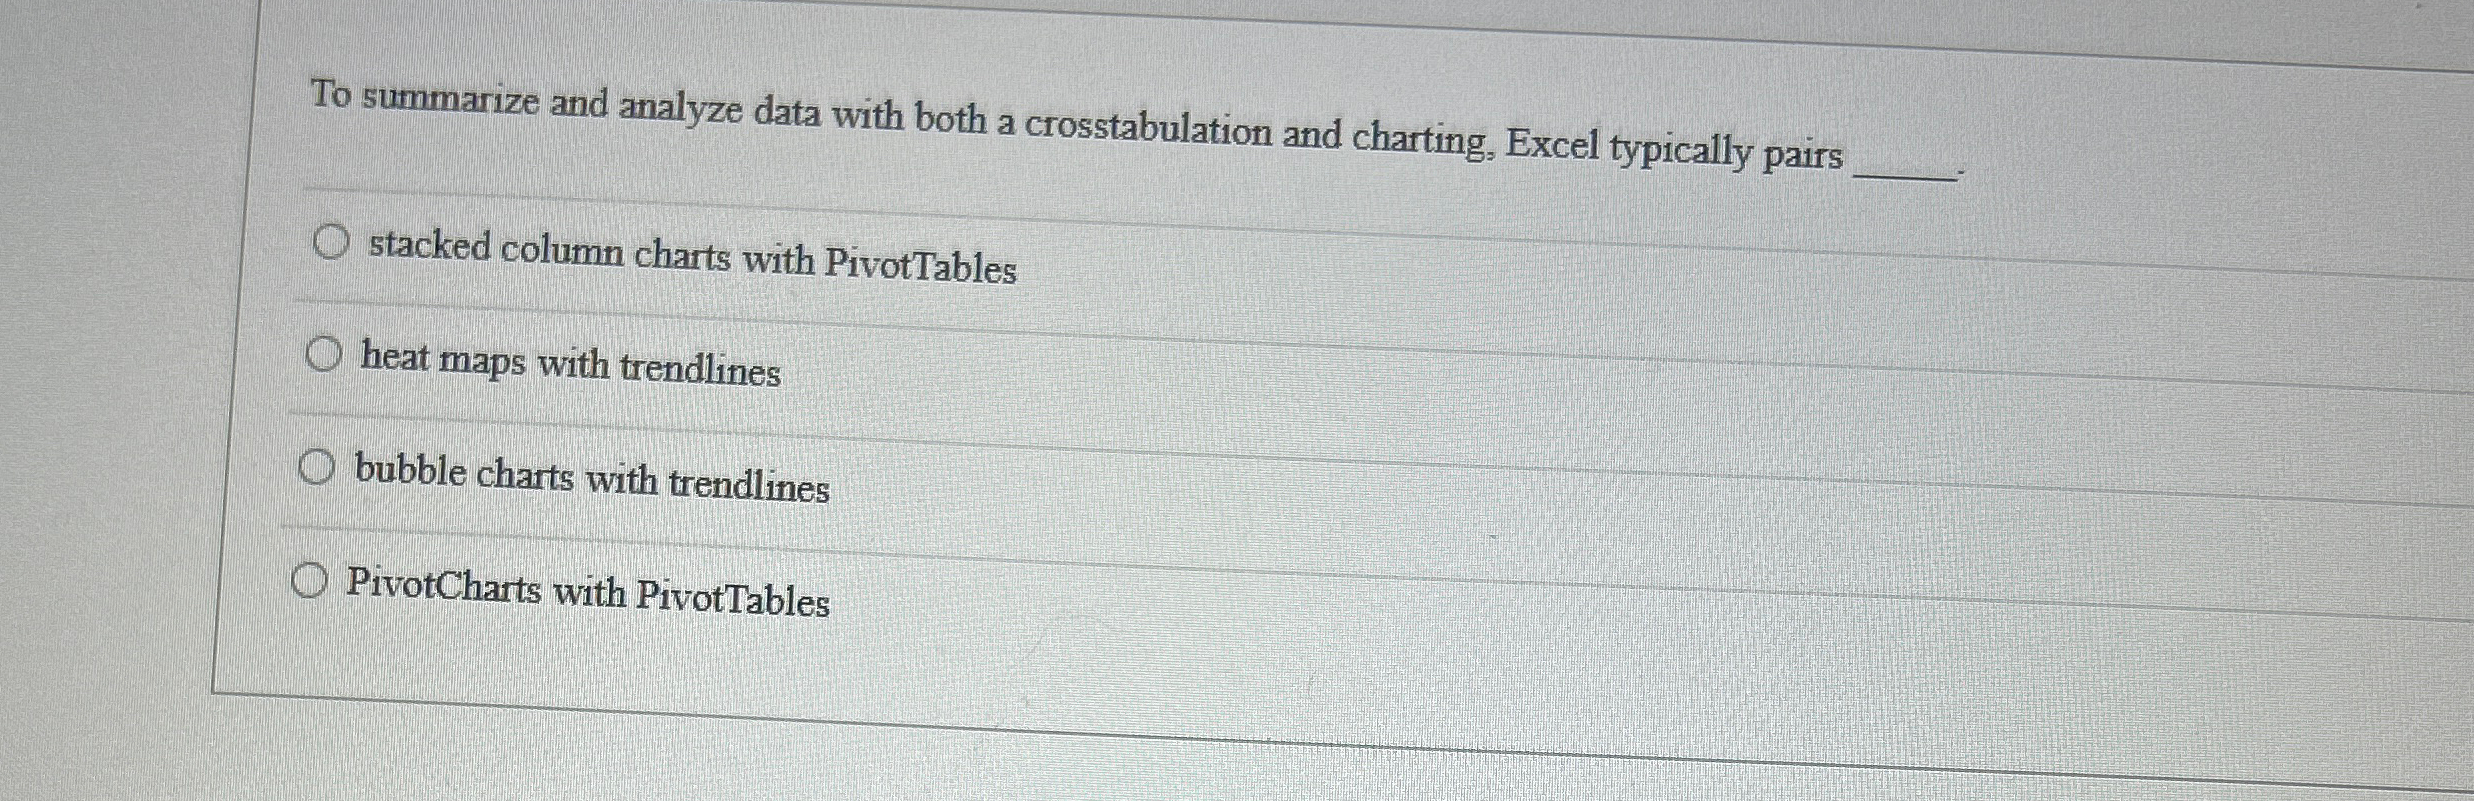
To summarize and analyze data with both a crosstabulation and charting, Excel typically pairs
stacked column charts with PivotTables
heat maps with trendlines
bubble charts with trendlines
PivotCharts with PivotTables
Step by Step Solution
There are 3 Steps involved in it
1 Expert Approved Answer
Step: 1 Unlock

Question Has Been Solved by an Expert!
Get step-by-step solutions from verified subject matter experts
Step: 2 Unlock
Step: 3 Unlock