

Question: Together with , partial sensitivity analysis fig explain the methodology to compute them; i.e., the idea behind the method and how you did it. The
Together with , partial sensitivity analysis fig explain the methodology to compute them; i.e., the idea behind the method and how you did it. The explanation should have about ten to twelve lines for each method. If you are using any programming language, submit the codes. If you are doing it on excel, submit your excel file clearly showing how you are doing each step.
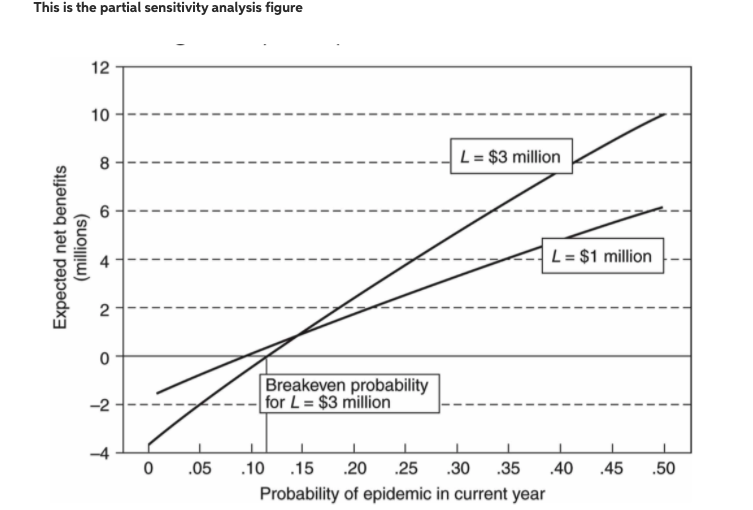
\"is is the partial sensitivity analysis gure i. = $1 million 0 .05 .10 .15 .20 .25 .30 .35 .40 .45 .50 Probability oi epidemic in current year
Step by Step Solution
There are 3 Steps involved in it
1 Expert Approved Answer
Step: 1 Unlock

Question Has Been Solved by an Expert!
Get step-by-step solutions from verified subject matter experts
Step: 2 Unlock
Step: 3 Unlock