

Question: Together with the figures, explain the methodology to compute them; i.e., the idea behind the method and how you did it. The explanation should have
Together with the figures, explain the methodology to compute them; i.e., the idea behind the method and how you did it. The explanation should have about ten to twelve lines for each method. If you are using any programming language, submit the codes. If you are doing it on excel, submit your excel file clearly showing how you are doing each step.
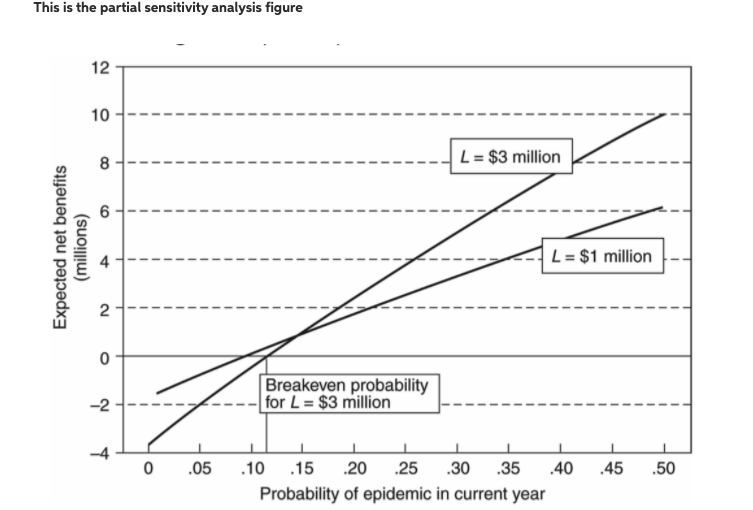
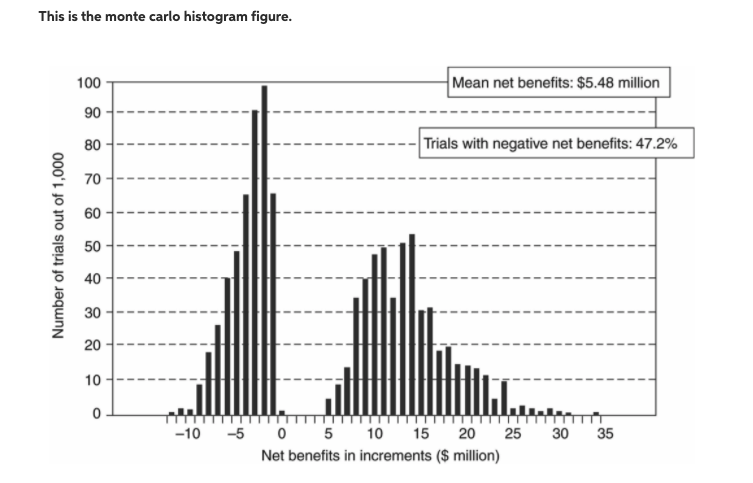
\"is is the partial sensitivity analysis gure i. = $1 million 0 .05 .10 .15 .20 .25 .30 .35 .40 .45 .50 Probability oi epidemic in current year This is the monte carlo histogram figure. 100 Mean net benefits: $5.48 million 90 80 Trials with negative net benefits: 47.2% Number of trials out of 1,000 70 60 50 40 30 20 10 -- - 0 -10 -5 0 5 10 15 20 25 30 35 Net benefits in increments ($ million)
Step by Step Solution
There are 3 Steps involved in it

Get step-by-step solutions from verified subject matter experts