Question: top pictures question says Twelve samples, each containing five parts, were taken from a process that produces steel rods at Emmanual Kodzi's factory. The

top pictures question says " Twelve samples, each
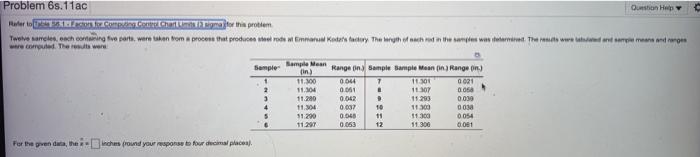
top pictures question says " Twelve samples, each containing five parts, were taken from a process that produces steel rods at Emmanual Kodzi's factory. The length of each rod in the samples was determined. The results were tabulated and sample means and ranges were computed. The results were:"
heres a better look at the table top pictures question says " Twelve samples, each
Problem 6s.11ac Question Help Rate to comprehriator this problem Twelve ameachmaning parts were taken om process that producere poteftatedry The whow rod in the same was in the www meron romuld. The results were 2 3 4 5 11.30 11.04 11.200 11.04 51200 Rangeon) Sample Sample Mean Range :) 0.04 7 11.301 0021 0.001 11307 0.056 0.042 11203 0.030 0.037 10 11300 003 11 11.300 0.054 0.053 12 11.300 0.001 0.04 For the genduta, the -B Inches fround your response to four decal placea) Definition Upper Range, D4 Lower Range, D3 0 0 Sample Size, n 2 3 4 5 6 7 8 9 10 12 Mean Factor, A2 1.880 1.023 0.729 0.577 0.483 0.419 0.373 0.337 0.308 0.266 3.268 2.574 2.282 2.115 2.004 1.924 1.864 1.816 1.777 1.716 0 0 0.076 0.136 0.184 0.223 0.284 Print Done For the given data, the x = inches (round your response to four decimal places). Based on the sampling done, the control limits for 3-sigma x chart are: Upper Control Limit (UCL) = inches (round your response to four decimal places). Lower Control Limit (LCL,) inches (round your response to four decimal places). Based on the x-chart, is one or more samples beyond the control limits? (1). For the given data, the R = inches (round your response to four decimal places). The control limits for the 3-sigma R-chart are: Upper Control Limit (UCLR)= inches (round your rosponse to four decimal places). Lower Control Limit (LCLR) - inches (round your response to four decimal places). Based on the R-chart, is one or more samples beyond the control limits? (2) Sample Range (in.) Sample Sample Mean (in.) Range (in.) 1. 2 3 4 5 6 Sample Mean (in.) 11.300 11.304 11.289 11.304 11.299 11.297 0.044 0.051 0.042 0.037 0.048 0.053 7 8 9 10 11 12 11.301 11.307 11.293 11.303 11.303 11.306 0.021 0.058 0.039 0.038 0.054 0.061 places)

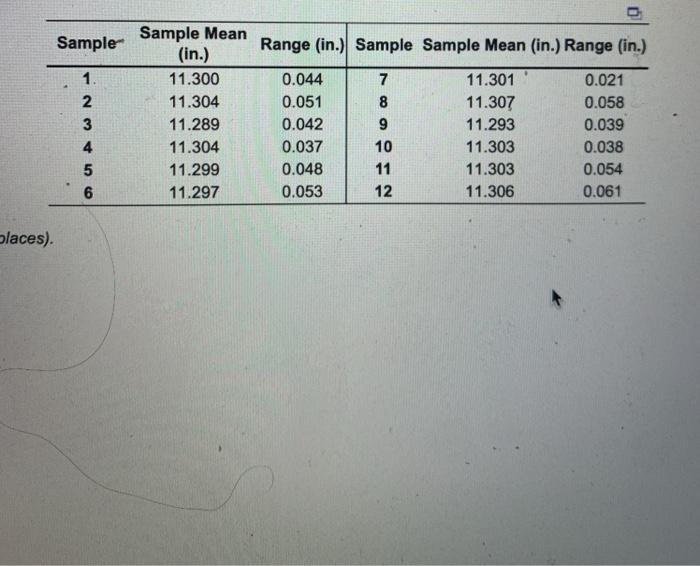
Step by Step Solution

There are 3 Steps involved in it

1 Expert Approved Answer
Step: 1 Unlock blur-text-image
Question Has Been Solved by an Expert!

Get step-by-step solutions from verified subject matter experts

Step: 2 Unlock
Step: 3 Unlock

Students Have Also Explored These Related General Management Questions!