

Question: Based on the sampling done, the control limits for 3-sigma chart are Upper Control Limit: ? (Round to 4 decimal places) Lower Control Limit: ?
Based on the sampling done, the control limits for 3-sigma chart are Upper Control Limit: ? (Round to 4 decimal places) Lower Control Limit: ? (Round to 4 decimal places) Based on X(bar above it) chart, is one or more samples beyond the control limits? Yes or No? R (One bar above it) = ? inches Upper Range (D4) Lower Range (D3)
The control limits for 3- Sigma R chart are: Upper Control Limit (UCLR): ? Lower Control Limit (UCLR) :? Based on the R-Chart, is one or more samples beyond the control limits? Yes or No?
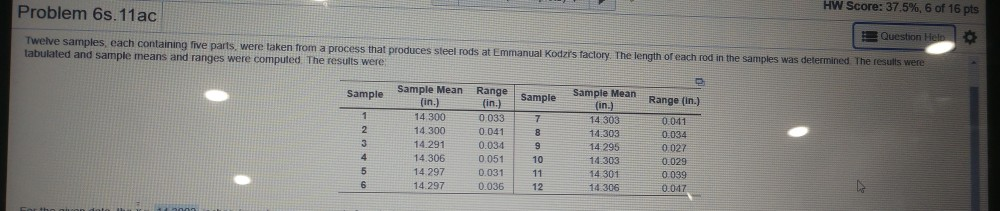
Problem 6s.11ac Question Hell Twelve samples, each containing five parts were taken from a process that produces steel rods at Emmanual Kodi's factory. The length of each rod in the samples was determined. The results were tabulated and sample means and ranges were computed. The results were: Sample Sample Range (in.) Sample Mean Range (in.) (in.) 14 300 0033 14.300 0.041 14.291 0.034 14.306 0 051 14 297 0.031 14.297 0.036 Sample Mean (in.) 14 303 14:303 14 295 14.303 14 301 14 306 0.041 0.034 0.027 0.029 0 039 0.047 12Step by Step Solution
There are 3 Steps involved in it
1 Expert Approved Answer
Step: 1 Unlock

Question Has Been Solved by an Expert!
Get step-by-step solutions from verified subject matter experts
Step: 2 Unlock
Step: 3 Unlock