

Question: Topic: Construct an x-chart to be used in conjunction with an R-chart Valtec Electronics fills orders for its electronic components and parts by truck to
Topic: Construct an x-chart to be used in conjunction with an R-chart
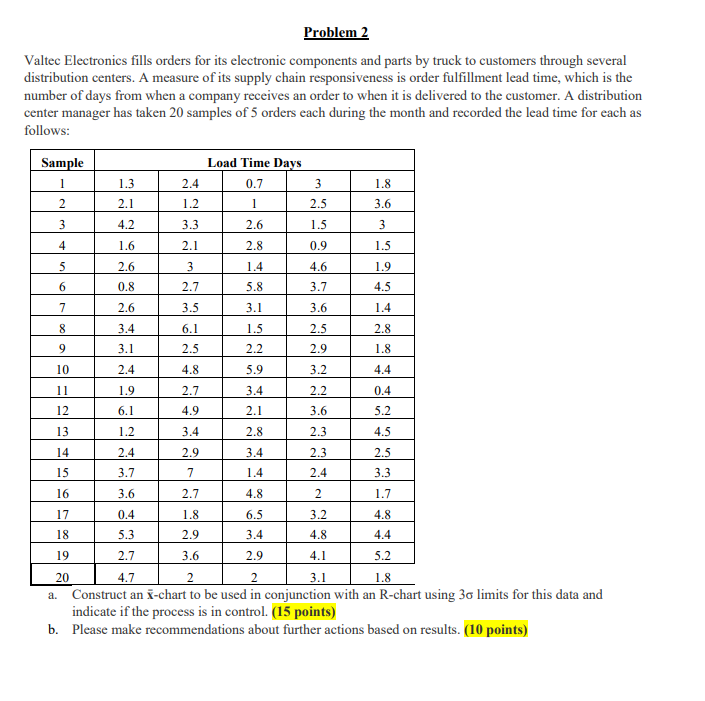
Valtec Electronics fills orders for its electronic components and parts by truck to customers through several distribution centers. A measure of its supply chain responsiveness is order fulfillment lead time, which is the number of days from when a company receives an order to when it is delivered to the customer. A distribution center manager has taken 20 samples of 5 orders each during the month and recorded the lead time for each as follows: a. Construct an x-chart to be used in conjunction with an K-chart using 3 limits for this data and indicate if the process is in control. (15 points) b. Please make recommendations about further actions based on results. (10 points)
Step by Step Solution
There are 3 Steps involved in it

Get step-by-step solutions from verified subject matter experts