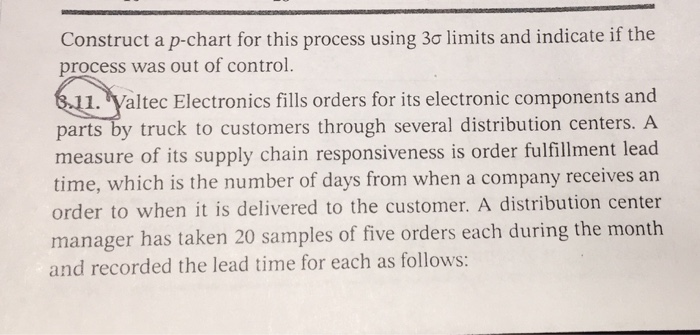
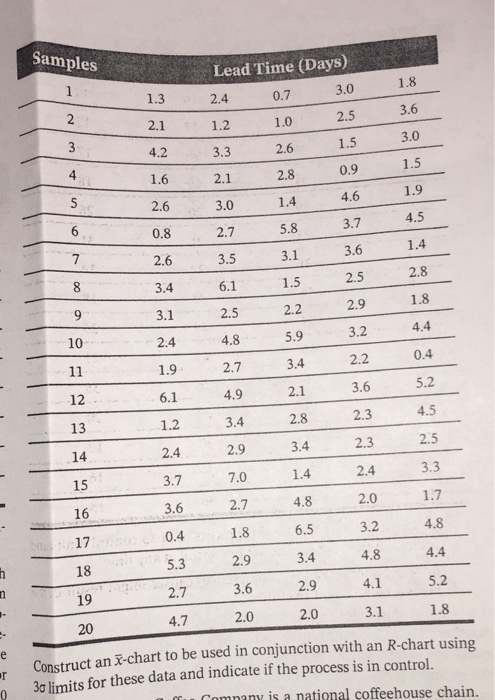
Question: Construct a p-chart for this process using 30 limits and indicate if the process was out of control. B.11. Valtec Electronics fills orders for its

Construct a p-chart for this process using 30
Construct a p-chart for this process using 30 limits and indicate if the process was out of control. B.11. Valtec Electronics fills orders for its electronic components and parts by truck to customers through several distribution centers. A measure of its supply chain responsiveness is order fulfillment lead time, which is the number of days from when a company receives an order to when it is delivered to the customer. A distribution center manager has taken 20 samples of five orders each during the month and recorded the lead time for each as follows: Samples - 2 - 5 - - 1.3 21 4.2 1.6 2.6 0.8 2.6 3. 4 3. 1 2.4 1.9 6.1 1.2 2.4 3.7 3.6 .4 5.3 2.7 4.7 8 9 -10 11 12 13 14 15 16 17 18 19 20 1.8 3.6 3.0 1.5 1.9 4.5 1.4 2.8 1.8 4.4 0.4 5.2 4.5 2.8 3. Lead Time (Days) 24 07 3.0 o 2.5 3.3 2.6 1.5 2.1 2.8 0.9 30 14 4.6 2.7 5.8 3.7 3.5 3.1 3.6 6 .1 1.5 2.5 2 5 2.2 2.9 4.8 5.9 3.2 2 2.7 3.4 2.2 4.9 21 36 3.4 2.8 2.3 2.9 3.4 2.3 7.0 14 24 2.7 4.8 2.0 1.8 6.5 3.2 2.9 3.4 4.8 3.6 2.9 4.1 2.0 2.0 3.1 1.7 0 4.8 4.4 5.2 1.8 a Construct an X-chart to be used in conjunction with an R-chart using 30 limits for these data and indicate if the process is in control. Company is a national coffeehouse chain

Step by Step Solution

There are 3 Steps involved in it

1 Expert Approved Answer
Step: 1 Unlock blur-text-image
Question Has Been Solved by an Expert!

Get step-by-step solutions from verified subject matter experts

Step: 2 Unlock
Step: 3 Unlock

Students Have Also Explored These Related General Management Questions!