

Question: TR TC TR TC TO O (b) (d) 35 Which graph in the figure above shows a typical firm's total revenue and total cost curves

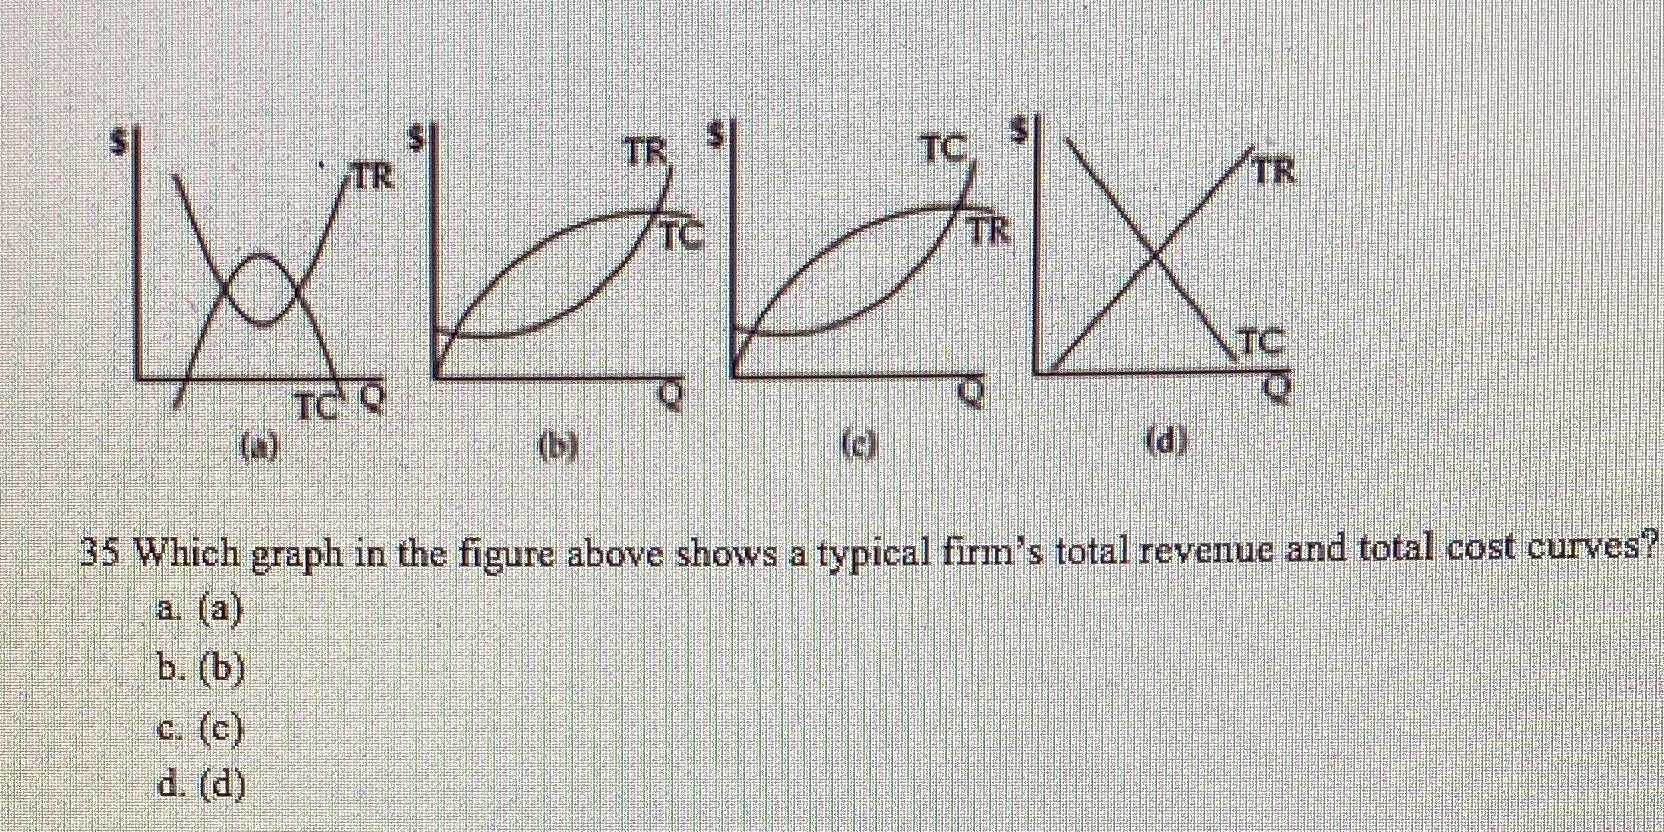
TR TC TR TC TO O (b) (d) 35 Which graph in the figure above shows a typical firm's total revenue and total cost curves a (a) b. (b) c. (C) d. (d)
Step by Step Solution
There are 3 Steps involved in it
1 Expert Approved Answer
Step: 1 Unlock

Question Has Been Solved by an Expert!
Get step-by-step solutions from verified subject matter experts
Step: 2 Unlock
Step: 3 Unlock