

Question: An analysis of a laboratory activity resulted in the first table below. After this analysis, the managers determined that their element descriptions were not
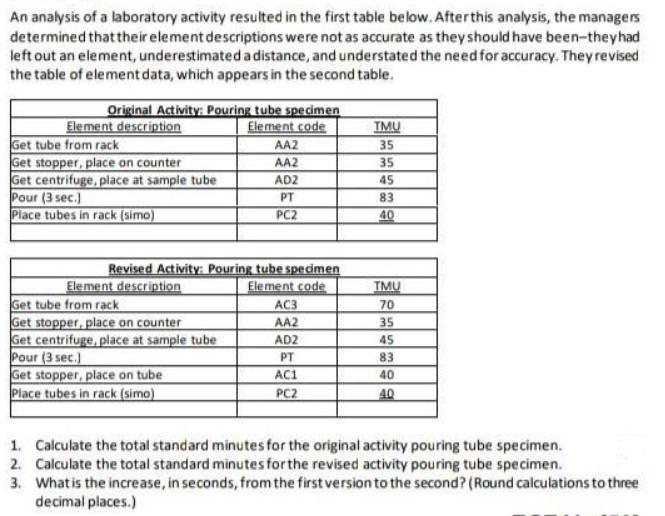
An analysis of a laboratory activity resulted in the first table below. After this analysis, the managers determined that their element descriptions were not as accurate as they should have been-they had left out an element, underestimated a distance, and understated the need for accuracy. They revised the table of element data, which appears in the second table. Original Activity: Pouring tube specimen Element code Element description Get tube from rack Get stopper, place on counter Get centrifuge, place at sample tube Pour (3 sec.) Place tubes in rack (simo) Revised Activity: Pouring tube specimen Element code Element description AA2 AA2 AD2 PT PC2 Get tube from rack Get stopper, place on counter Get centrifuge, place at sample tube Pour (3 sec.) Get stopper, place on tube Place tubes in rack (simo) AC3 AA2 AD2 PT AC1 PC2 TMU 35 35 45 83 40 TMU 70 35 45 83 40 40 1. Calculate the total standard minutes for the original activity pouring tube specimen. 2. Calculate the total standard minutes for the revised activity pouring tube specimen. What is the increase, in seconds, from the first version to the second? (Round calculations to three decimal places.) 3.
Step by Step Solution
3.33 Rating (147 Votes )
There are 3 Steps involved in it
1 Original Activity Element Code AAZ AA2 AD2 PT PC2 ... View full answer

Get step-by-step solutions from verified subject matter experts