

Question: TRAFFIC ENGINEERING - plan and design new highway and decide it is two lane or multilane highway or expressway - analyse anual average daily traffic
TRAFFIC ENGINEERING 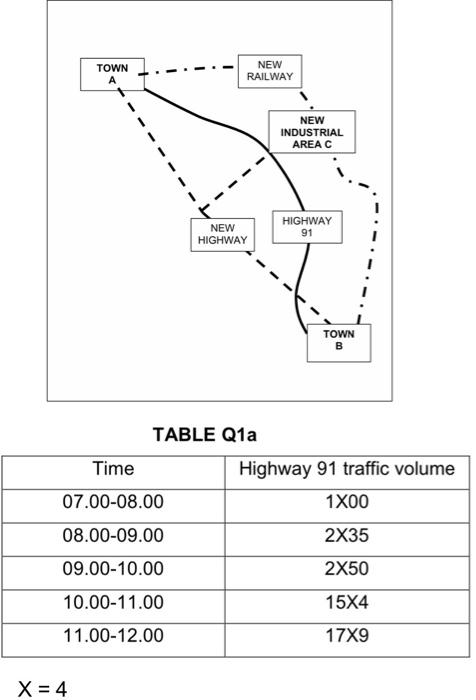
- plan and design new highway and decide it is two lane or multilane highway or expressway
- analyse "anual average daily traffic" (AADT) of highway 91 (table Q1a)
- adjust AADT from the permanent counter station
Step by Step Solution
There are 3 Steps involved in it
1 Expert Approved Answer
Step: 1 Unlock

Question Has Been Solved by an Expert!
Get step-by-step solutions from verified subject matter experts
Step: 2 Unlock
Step: 3 Unlock