

Question: Trend Analysis 4. Complete a trend analysis from the following data of Carter Corporation using 2019 as the base year. (Round to the nearest percent.)
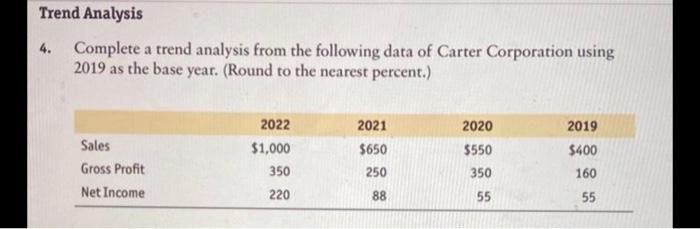
Trend Analysis 4. Complete a trend analysis from the following data of Carter Corporation using 2019 as the base year. (Round to the nearest percent.) 2019 2021 $650 Sales Gross Profit Net Income 2022 $1,000 350 220 2020 $550 350 55 $400 160 250 88 55
Step by Step Solution
There are 3 Steps involved in it
1 Expert Approved Answer
Step: 1 Unlock

Question Has Been Solved by an Expert!
Get step-by-step solutions from verified subject matter experts
Step: 2 Unlock
Step: 3 Unlock